Trying to retrieve Telraam data using R

I am trying to use the API with R but have difficulties retrieving the data from the server.

I tried:

library(httr)
library(jsonlite)
library(tidyverse)
library(hrbrthemes)

get_telraam_data <- function(id = "9000001463",
                       time_start = "2022-10-01 00:00:00Z",
                       time_end = "2022-10-02 00:00:00Z",
                       level = "segments",
                       format = "per-hour") {
  
  request_body <- data.frame(
    id = id,
    time_start = time_start,
    time_end = time_end,
    level = level,
    format = format
  )

  request_body_json <- toJSON(list(json = request_body), auto_unbox = TRUE)
  
  res <- POST(
    url = sprintf("https://telraam-api.net/v1/reports/traffic"),
    body = request_body_json,
    encode = "json",
    add_headers(.headers = c("X-Api-Key" = "xxx Access Token xxx")),
                verbose()
  )

  stop_for_status(res)

  content(res, as="text", encoding="UTF-8") %>%
    fromJSON(flatten=TRUE) %>%
    as_tibble() %>%
    readr::type_convert()
}

This leads to a bad request.
Error in get_telraam_data() : Bad Request (HTTP 400).

Where am I wrong?

This is an interesting question. Most of us arenā€™t familiar with R but it seems that the parameters are correct. I assume you entered your API key correctly?

I wonder if anyone else has any ideas? I think @Romain_Dalston might have some skills in this area? Any other data / R specialists who can assist with this syntax?

So the issue seems to be with the body of the request. Rather than passing the body as a JSON, you can generate the body (somewhat inelegantly) with paste0. This was a pain to get right with all the escaped and control characters, but this seems to work now:

get_telraam_data <- function(id = "348917",
                             time_start = "2020-10-30 07:00:00Z",
                             time_end = "2020-10-30 09:00:00Z",
                             level = "segments",
                             format = "per-hour") {
  
  request_body <- paste0("{\r\n",
                         "\"id\": \"", id, "\",\r\n",
                         "\"format\": \"", format, "\",\r\n",
                         "\"time_start\": \"", time_start, "\",\r\n",
                         "\"time_end\": \"", time_end, "\",\r\n",
                         "\"level\": \"", level, "\"\n}")
  
  res <- POST(
    url = sprintf("https://telraam-api.net/v1/reports/traffic"),
    body = request_body,
    add_headers(.headers = c("X-Api-Key" = "xxx"))
  )

  stop_for_status(res)

  content(res, as="text", encoding="UTF-8") |> 
    fromJSON(flatten=TRUE) %>%
    as_tibble() %>%
    readr::type_convert()

}

I donā€™t know if the issue with passing the body as a JSON is an issue with the API or with httr, but whatever variations I tried, I couldnā€™t get it to work either.

Iā€™m using R too - I got it to work with help from a friend but now I am struggling to visualise the output!

------------------------------------------------------------------------------

Accessing the Telraam API

21.9.2023

------------------------------------------------------------------------------

#install.packages(ā€˜httrā€™)
library(httr)

#install.packages(ā€˜jsonliteā€™)
library(jsonlite)

request_body ā† list(

ā€œlevelā€=ā€œsegmentsā€,

ā€œformatā€=ā€œper-hourā€,

ā€œidā€=ā€œ9000001390ā€,

ā€œtime_startā€=ā€œ2021-06-01 07:00:00Zā€,

ā€œtime_endā€=ā€œ2021-06-30 09:00:00Zā€

)

request_body_json ā† toJSON(request_body, auto_unbox=TRUE)

request ā† POST(

ā€œhttps://telraam-api.net/v1/reports/trafficā€,

body=request_body_json,

add_headers(

"X-Api-Key"="XXXXXXXXXXXXXXXXXXXXXXXXXXXXXXX",

"Content-Type"="application/json"

),

verbose()

)

output ā† content(request)

print(output$report)

plot(output$report[[698]]$car_speed_hist_0to120plus[[23]])


Can anyone help me on a Shiny code to visualise this? Itā€™s resisting all attempts to plot more than one point!

Christina

@c.m.b.biggs There may be a more elegant way to do this, but the following code constructs a new data frame for the speed data (replacing your code starting at output ā† content(request))

x  <- content(request, as="text", encoding="UTF-8") |> 
    fromJSON(flatten=TRUE) %>%
    as_tibble() %>%
    readr::type_convert()


# create labels for the speed bins
# car_speed_hist_0to120plus: the estimated car speed distribution in 5 km/h bins from 0 to 120+ km/h (in percentage of the total 100%)
lower <- seq(0, 120, 5)
upper <- seq(5, 125, 5)

create_speed_bin <- function(x, y) {
  paste0("speed_", x, "_to_", y)
}

speed_bins <- map2_chr(lower, upper, create_speed_bin)
#relabel the top category
speed_bins[length(speed_bins)] <- "speed_120+"

# construct new data frame for speed data
z <- x$report$car_speed_hist_0to120plus
names(z) <- x$report$date

speed_data <- cbind(speed_bins, as_tibble(z)) |> 
  pivot_longer(cols = where(is.numeric), names_to = "time", values_to = "pct") |> 
  mutate(time = ymd_hms(time),
         speed_bins = fct_rev(speed_bins)) #reverse the order of speed bins
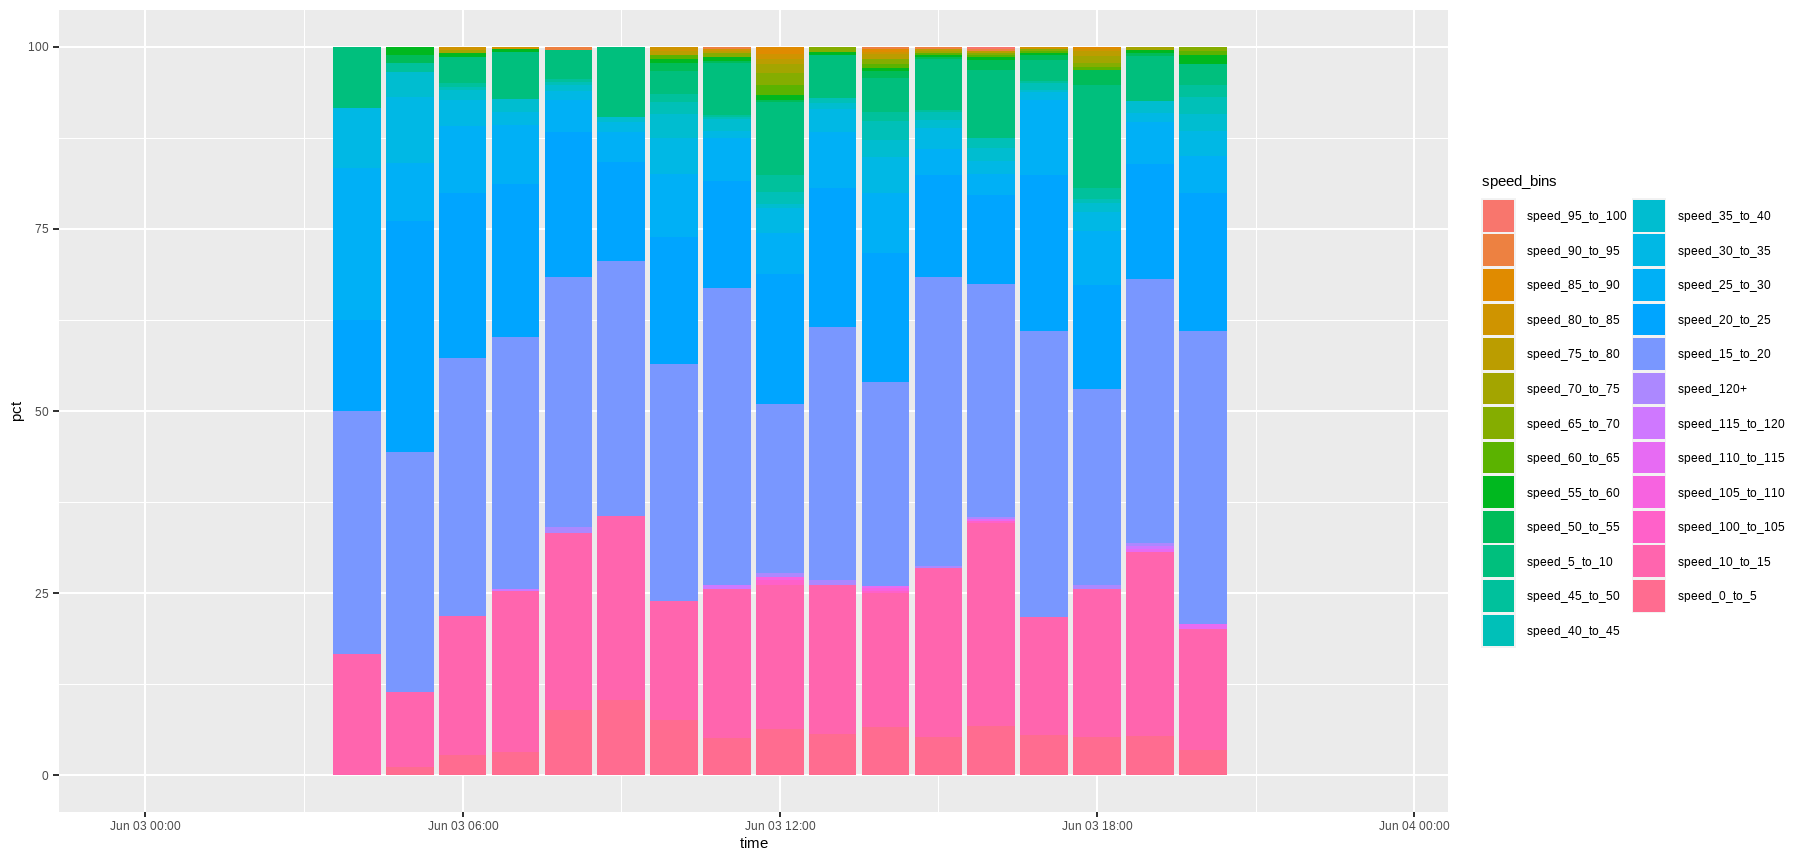
Hereā€™s an example of plot for a single day: (edit: This isnā€™t Shiny code yet; youā€™d have to wrap this in a renderPlot call and figure which pieces youā€™d want to be interactive)

# example of a plot for a single day
speed_data |> 
  filter(date(time) == "2021-06-03") |> 
  ggplot(aes(time, pct, group = speed_bins, fill = speed_bins)) +
  geom_col(position = "stack") +
  scale_x_datetime()

2 Likes

Thanks so much Kleims! It worked fine - once Iā€™d installed the right libraries.

2 Likes

Very nice chart. Has anybody some experience to display this kind of chart in a Wordpress based webpage? We plan to provide an interactive page on our Website, where users could select a time frame for a specific segment-id.

Is this chart a public accessible webpage?