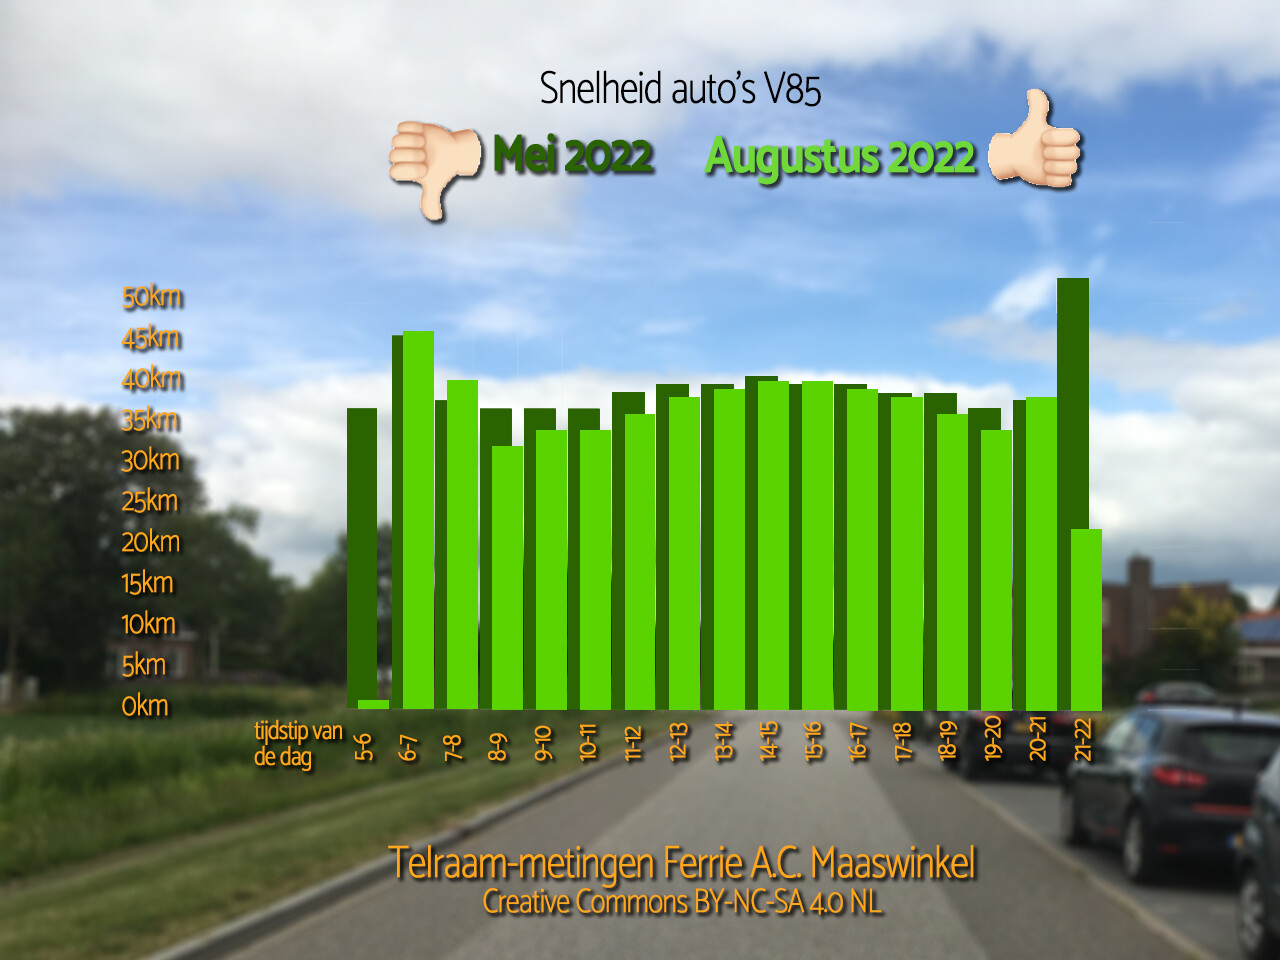
when the street where we live changes - for instance when concreet blocks are placed to slow down the speed of traffic - we like to know what the effect is of these measures are
then the comparision is a usefull tool to show people what the effect is
i made a blogpost (in Dutch) with more images and countings at my blog
my idea
make a comparision possible between two or more periods on a way like the image above - of course in the Telraam design style
I like the idea of turning all traffic counters into data miners!
A timeline of data can be really interesting, but as you say, sometimes the differences appear more obvious when you put the information side by side instead.
It’s a bit like those “before” and “after” diet images! 
I’m not sure how easy this would be to implement so that we could pick our own times to compare, but I’ll certainly raise it.
I wonder how others might use this for their data?
BTW, great images. I can’t read the text but I get the basic point and love how open your street is. Great to see traffic and speed dropping!
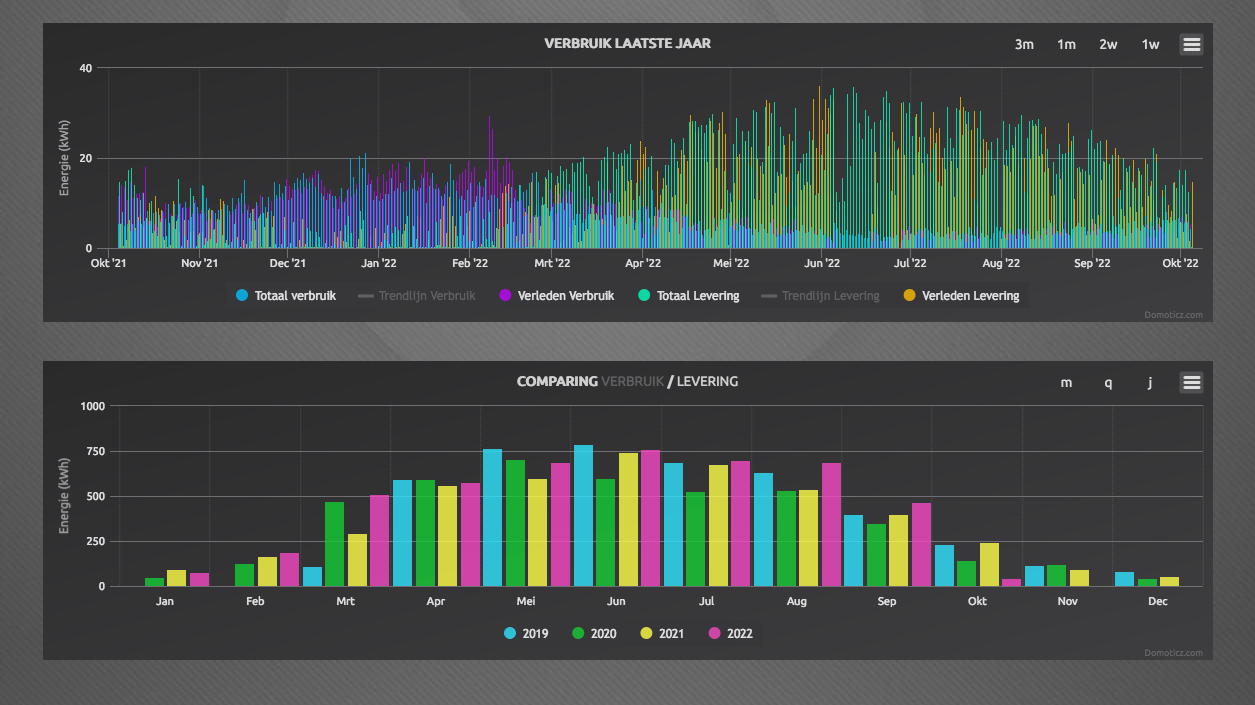
as a sample i’ll drop here a screenshot of my Domoticz - that is counting use and delivery of electricity from and to our house - we have sunpanels on the roof
in the lower graphic you see 4 years of delivery in one graphic
the graphis has 2 tabs - first is ‘use’ - second is ‘delivery’
this type of graphic could be be functioning in Telraam as well - although this sample is for the whole year
my request is for a specific time frame against a second time frame - by input of the user
a bit simplier then the Domoticz graphic
putting aside the traffic data for a moment … you export 750kWh a month? How big is your array of solar panels 
In a good month I export 300kWh … but that includes my V2G (vehicle to grid export from my electric car) …
Sorry, back to business …
yes - we have a very “energetic” house - we produce much more then we consume - on the roof there are 24 solarpanels - over the year we could drive our Renault ZOË and still have room for delivery - that sayd - i working on a cable gutter - first thing is to get the municipality of Heerenveen to support this idea - and that is a hard road to take 
1 Like
omg, love this page you made Ferrie!
I think you also made the right choice in your approach to comparing Telraam data. It’s better to compare V85 of a long timeseries (i.e. a month). This way, for every hour you have about 30 data-points. It’s safe to say that if the median value differs between 2 time periods, the difference is likely significant, just because you have so many data points.
One would expect the V85 to be a bit higher at times of low traffic, as higher traffic volumes slows down the speed of the passing cars. I think this clearly shows in your dataset as well, with highest speeds before morning peak or after evening peak (I’m disregarding the hours for which likely little data was available).
Nice work, keep posting your analysis. I hope you’ll be able to convince Heerenveen city authorities to scale-up and add more Telraam-units!
2 Likes
this morning i found out how to get in contact with the ‘Wethouder van Verkeer’ of the city of Heerenveen - you have to follow a procedure to get there - i was not ware of this “procedure”
as soon as i am able to talk about Telraam i’ll let you know @kris.vanherle
2 Likes