Splitting Two-Wheelers into Cycles and Motorbikes

Exciting news!

New data dashboards for the S2 are being developed and close to being deployed, and if you have an S2 with a ‘Pro’ subscription then you will be able to dive even deeper into the many modes that the S2 can track.

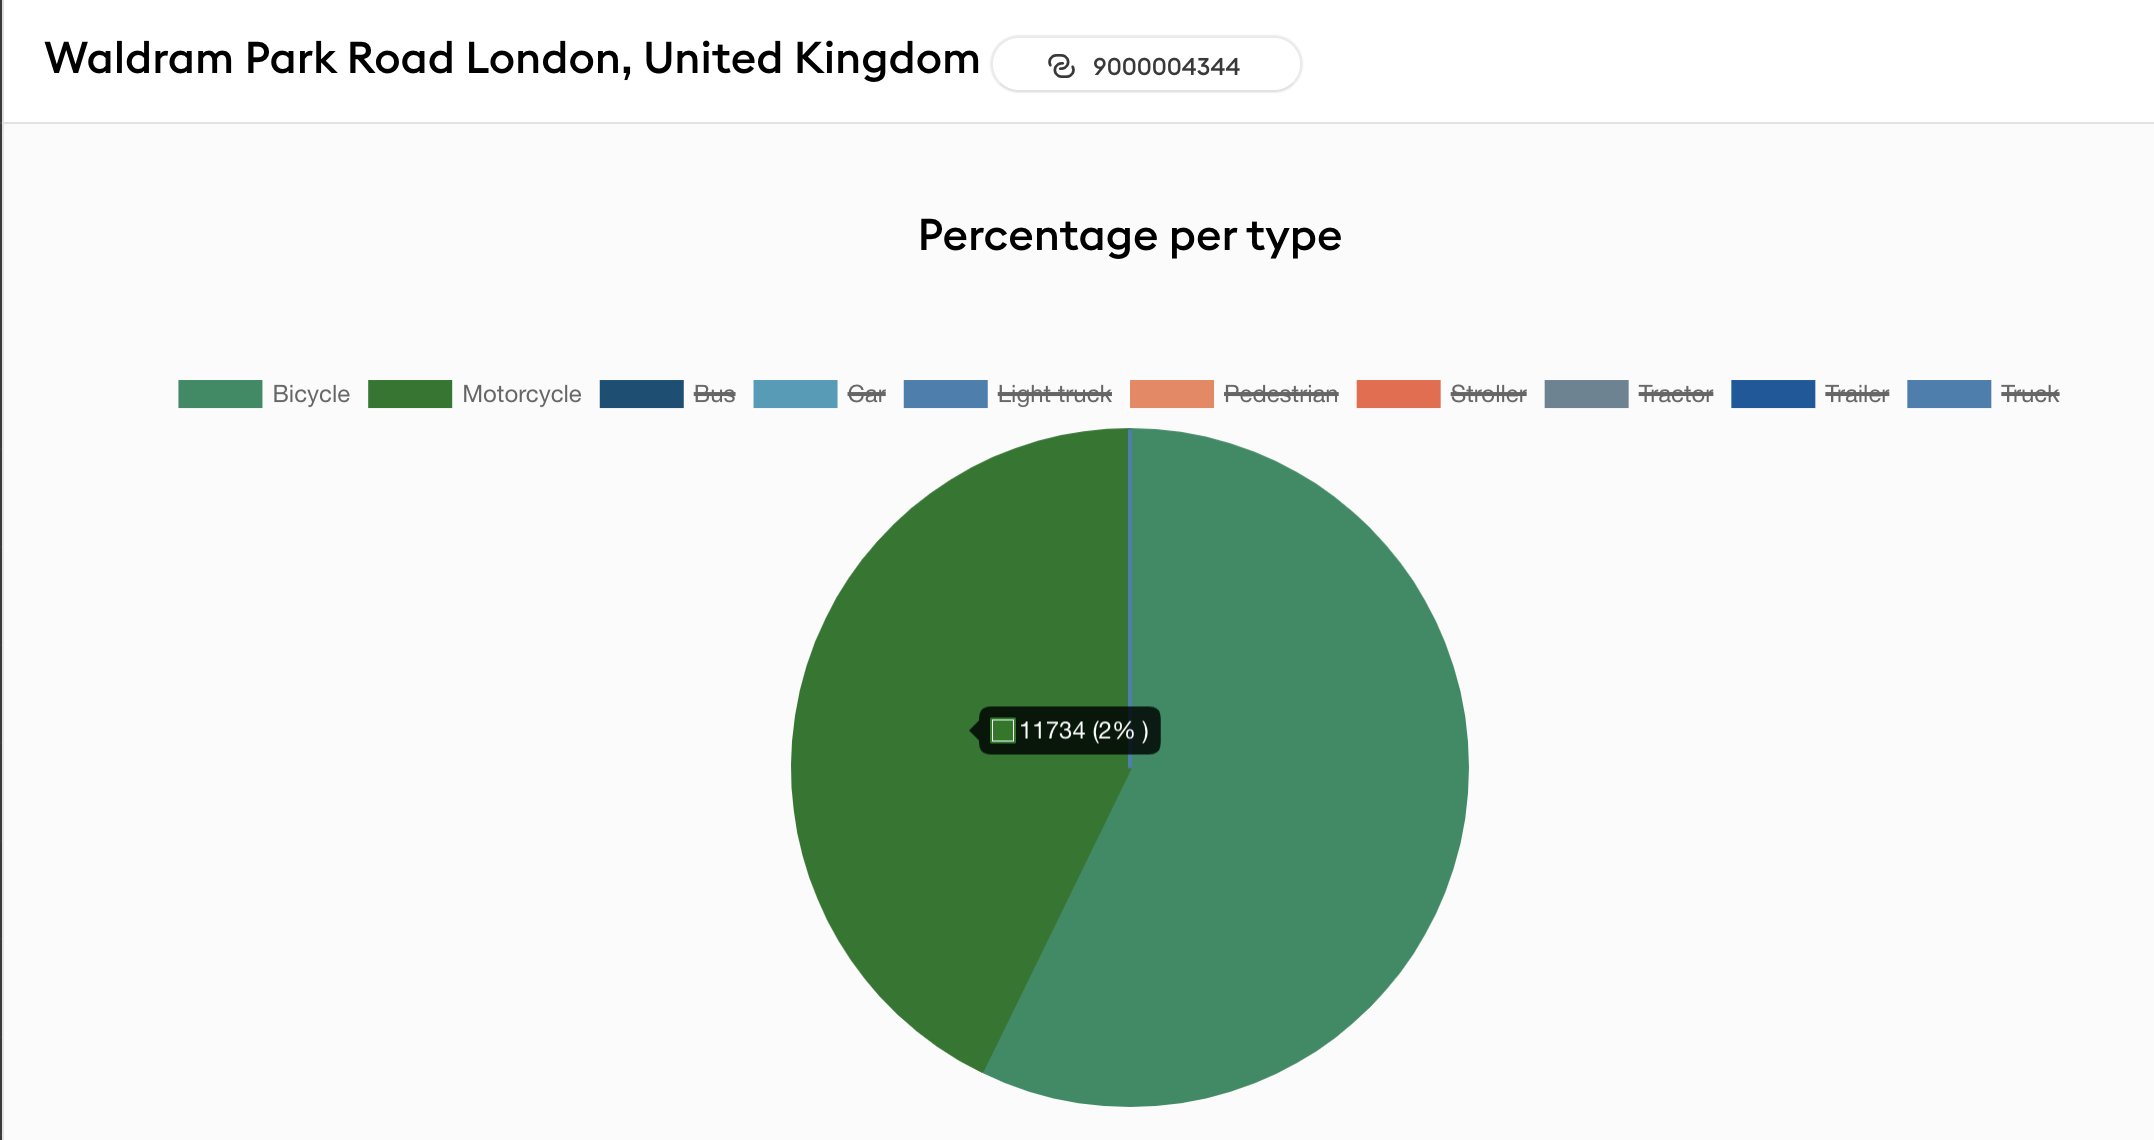
As a teaser, if you have an S2 device, I thought I would offer to show you the split of modes within the current “Two Wheeler” category. As you know, for historical technical reasons, we combine cycles and motorbikes into one of our four standard categories which is then shown to all users. However, the S2 is able to distinguish differences between these modes and count them separately.

Here’s the deal.

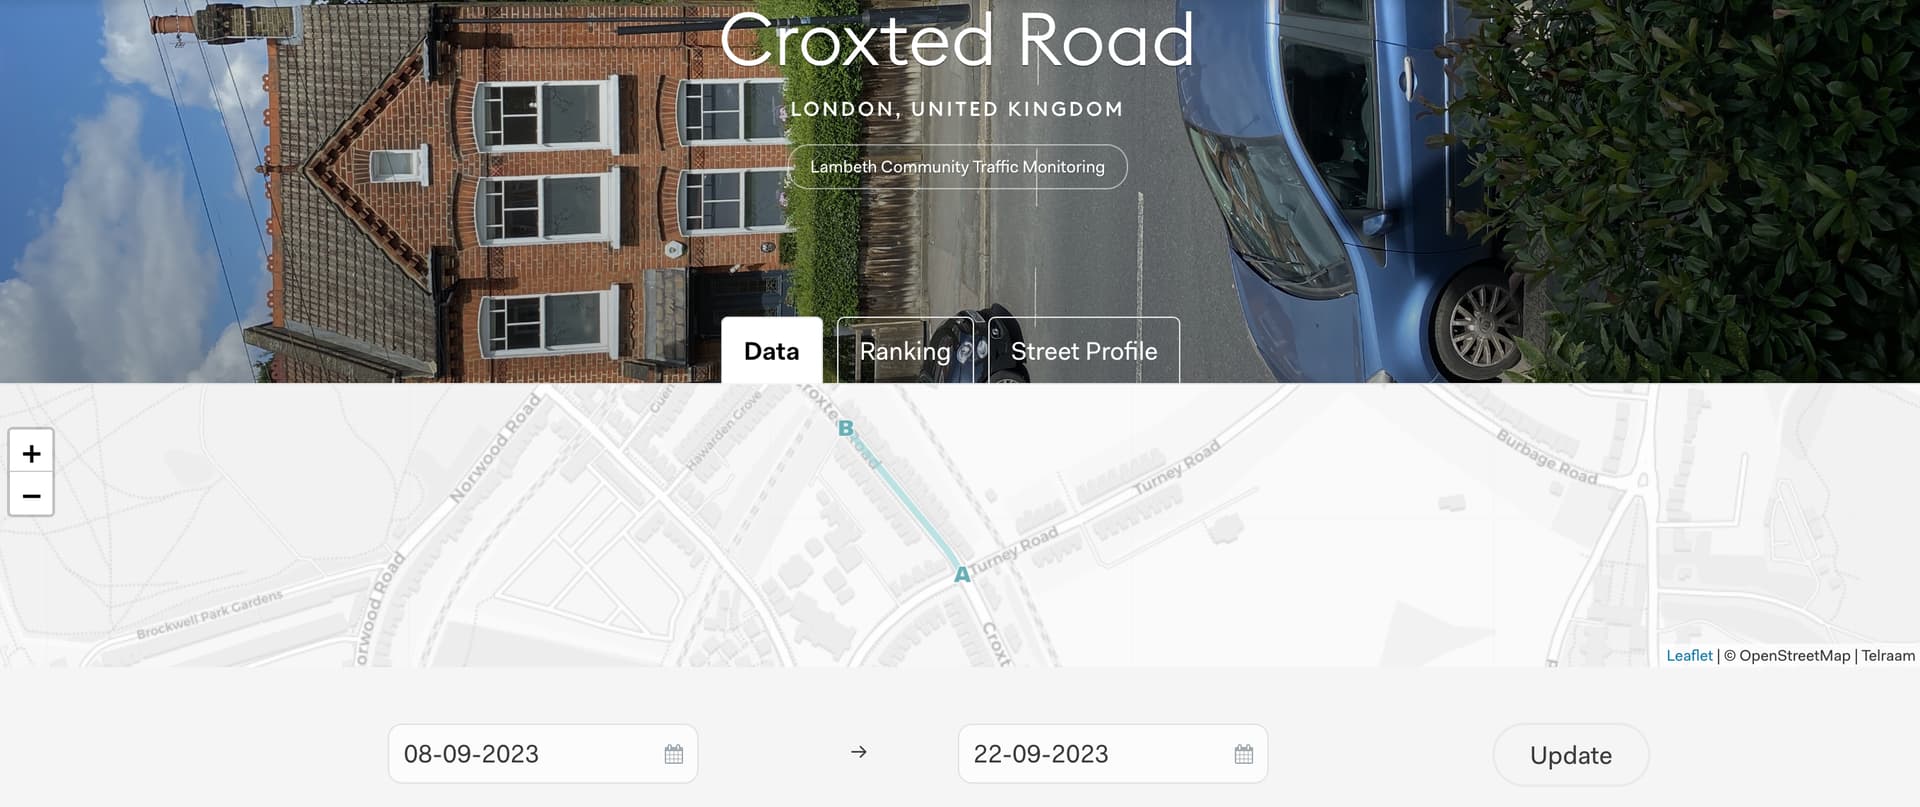
If you have an S2 (even if you don’t have the ‘Pro’ option), leave a reply below with a link to your location. You need to include your guess as to the % split between “cycles” and “motorbikes” that you would expect from your data for the last month.

I will then find the actual reported data and share it here for you.

Here’s my data as an example.

My device: Telraam | Waldram Park Road
Estimate (% of cyclists): 50%

Here’s the actual data:


Actual split: 57% cycle, 43% motorbike

1 Like

Location is 9000005087 and I’d guess 95% cycles and 5% motorbikes.

1 Like

Ooh, very good! Yes, you are pretty much spot on @DannyYee

I see you have a lot of pedestrians and cyclists on this particular segment.

In fact the split is closer to 97% cycles and 3% motorbikes (as detected)

Thanks, that’s really useful!

1 Like

Guessing 98/2. Just very few motorcycles (not a through street so lots of cars are circling for parking while motorcycles can easily park elsewhere…)

1 Like

Another good guess there @luis , or reasonable data :slight_smile:

In this case, the device counted just 19 “motorcycles” in the last month, and 1290 cycles, giving you a 98.5% / 1.5% split

1 Like

Anyone else fancy testing out their data? I can always look at other modes if you prefer :slight_smile:

Hi Rob,
I’d also go for a 95/5 for 9000005073.

1 Like

Thanks @ralf.bell

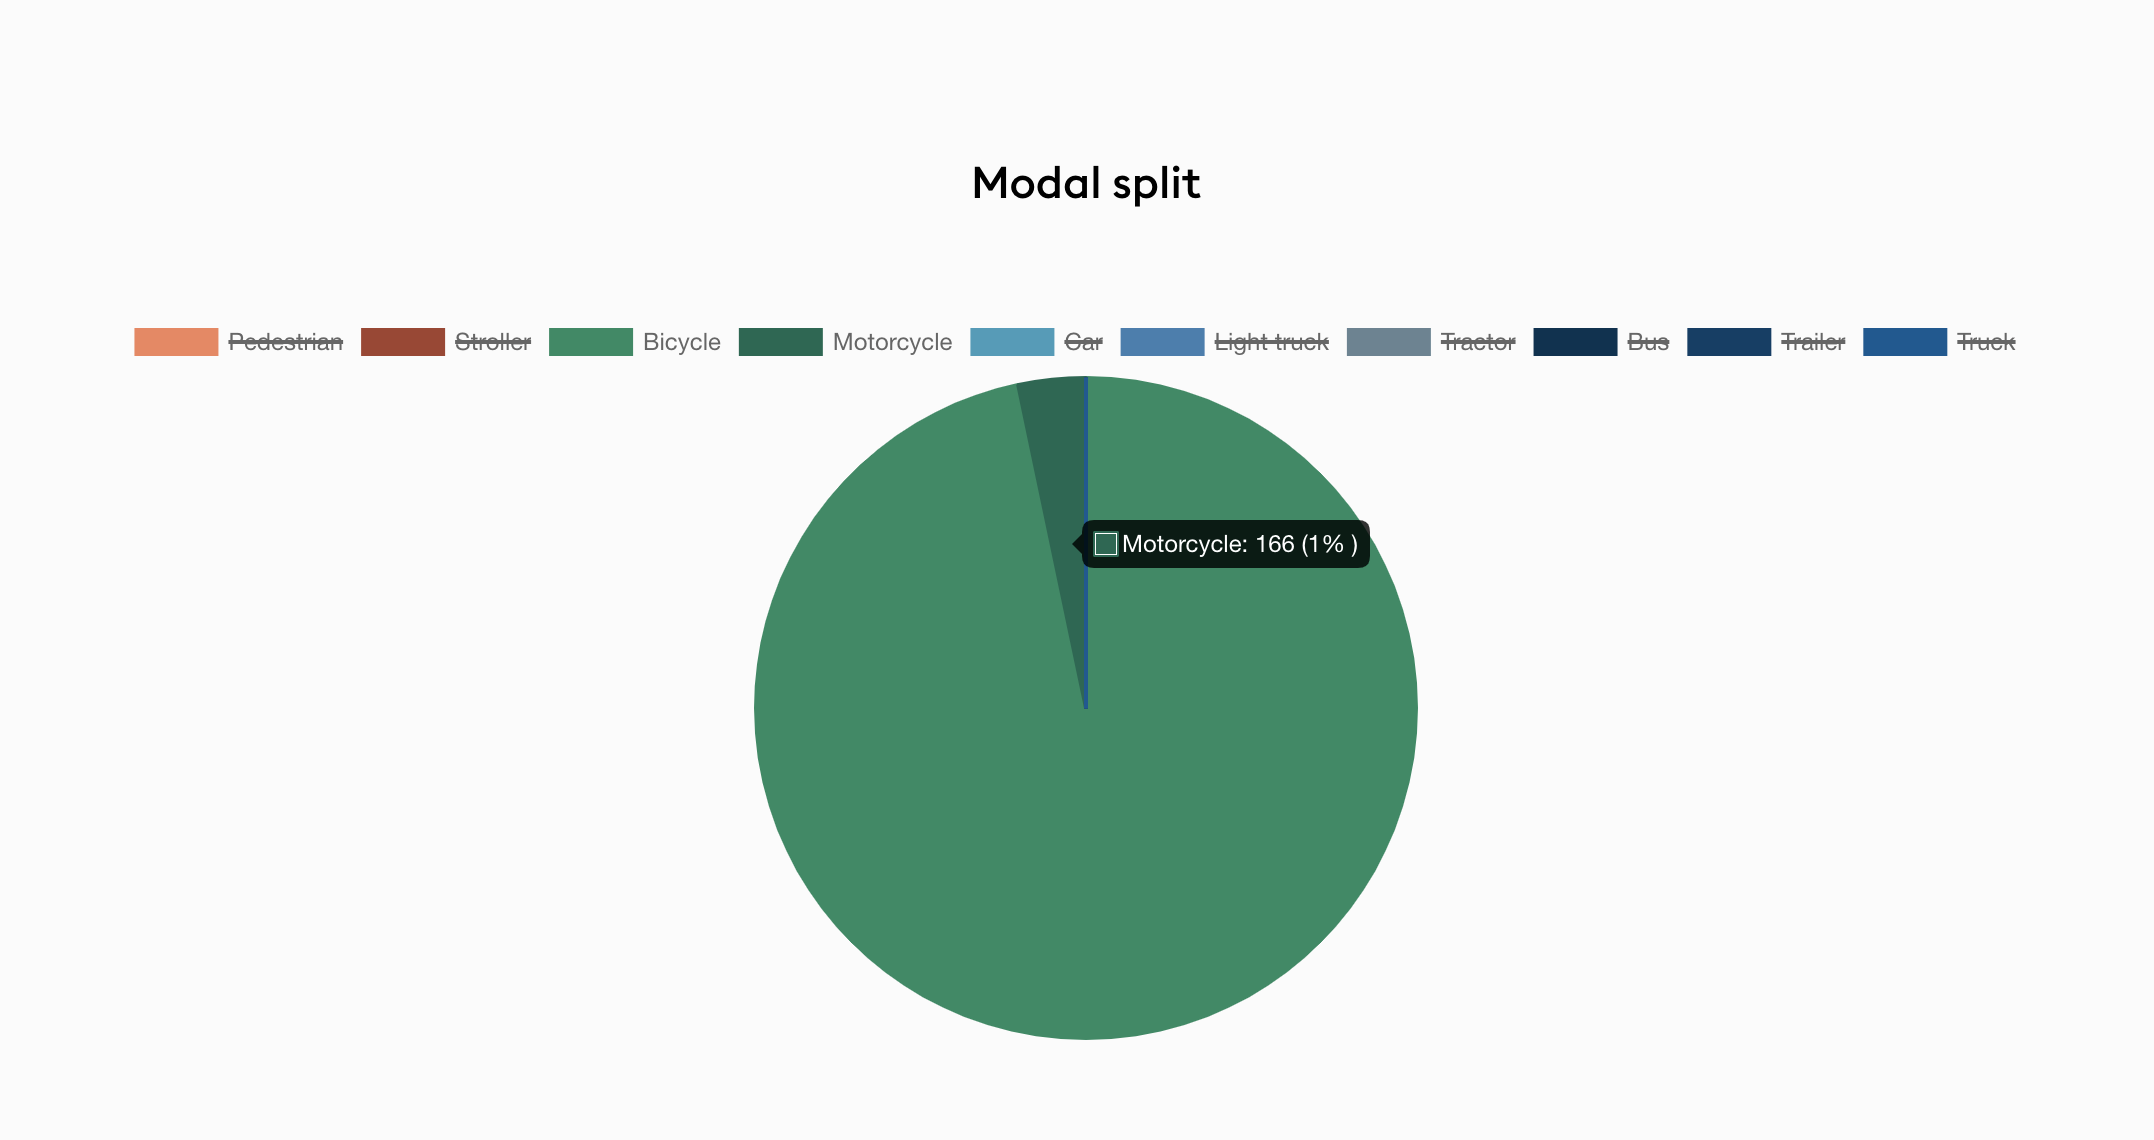
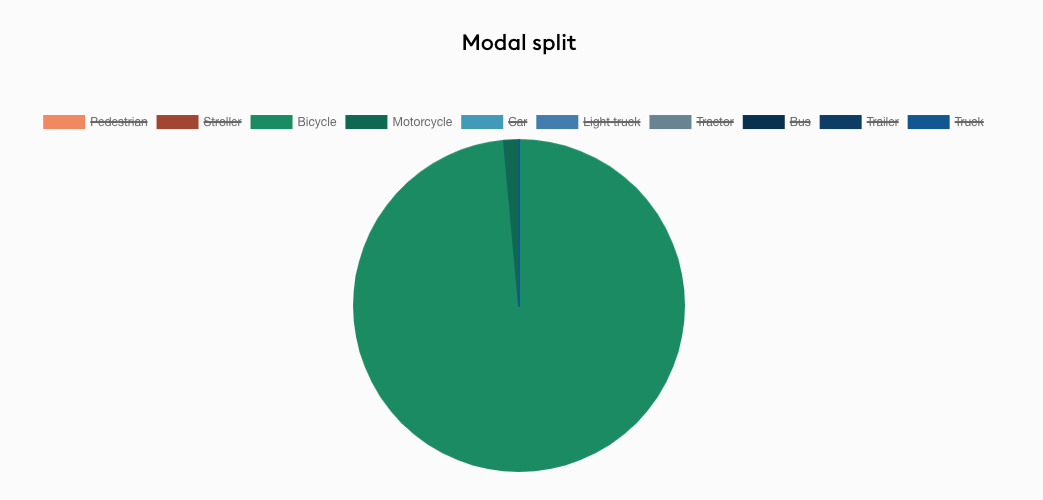
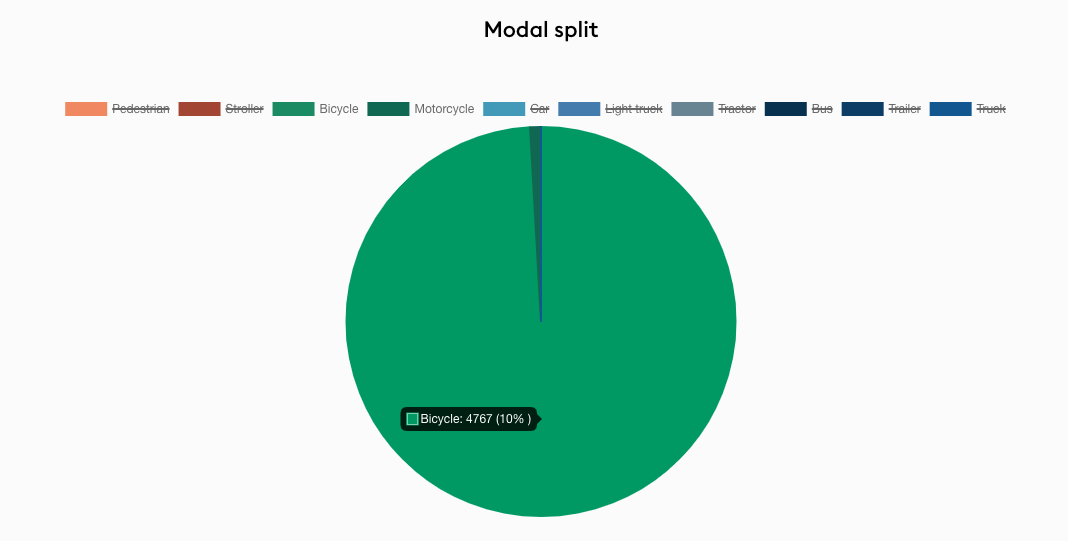
Indeed, you have a great many cycles as well, but in fact we only detected 43 motorbikes in the last month, compared to 4767 cycles (representing 10% of all measured traffic on your street) … so you are probably closer to 99% / 1% split

That sounds lovely (compared to my main road with 50/50% split)

Thank you @Rob_Telraam for the info!
I guess I overestimate motorcycles because I hear them more often than bikes. :wink:

2 Likes

How about if Telraam used sound from a microphone to help distinguish bikes and motorbikes? With gas motorbikes is pretty easy.

With electrics: well there’s not really any difference between a fast e-Bike and an electric motorcycle driven slowly really, so…

The S2 can already distinguish these two modes (using visual and speed clues I imagine)

This information will be available in the dashboard of anyone with a data subscription in the near future. I was just using this to dive into the data a bit more. Hopefully when your device has collected a bit more information @bryce2 I will be able to do the same with your data. Do you get many motorbikes?

Hi Rob
I’d take a guess at 9000005412 90/10
Many thanks

Pretty good guess :slight_smile:

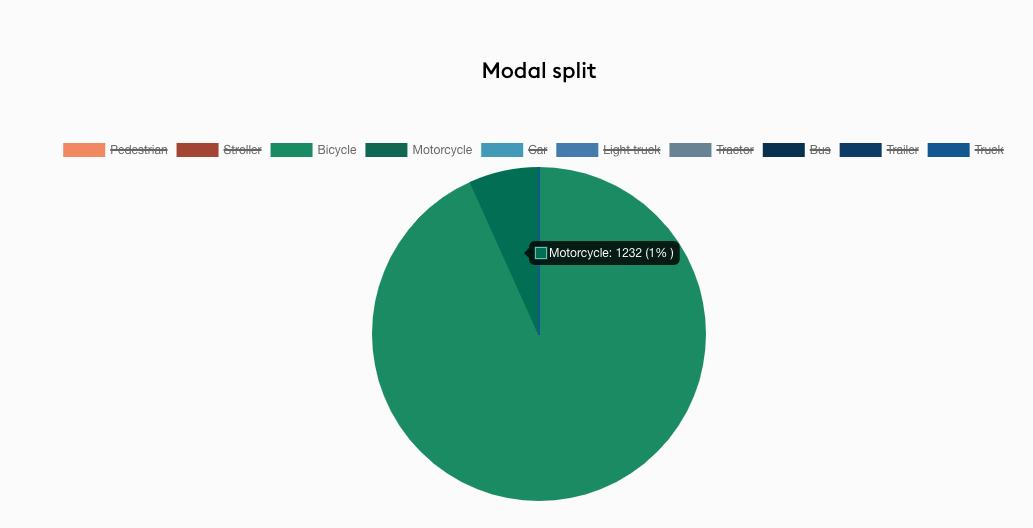
In the last month we’ve counted 18,301 two wheelers, and 1232 were motorbikes, so around 6.5%, and the rest being bicycles (which is a whopping 17,069!!!)

wow that’s a lot of bikes !! thank you
Can you breakdown between HGVs and big red buses?

also can you breakdown direction of traffic?

Do you mean overall? That is on the dashboard already (penultimate graphic):

yes!

So total trucks is around 40,750

Light truck (i.e. vans and smaller trucks): 70%
Bus: 16%
Large truck (HGV): 14%

Thanks so much. Can you confirm direction A-B and B-A ?
which one is South to North (or right to left from sensor viewpoint)?

That is on the map too - and was set during the set-up

Sorry I can see it now. Many thanks for your help

1 Like