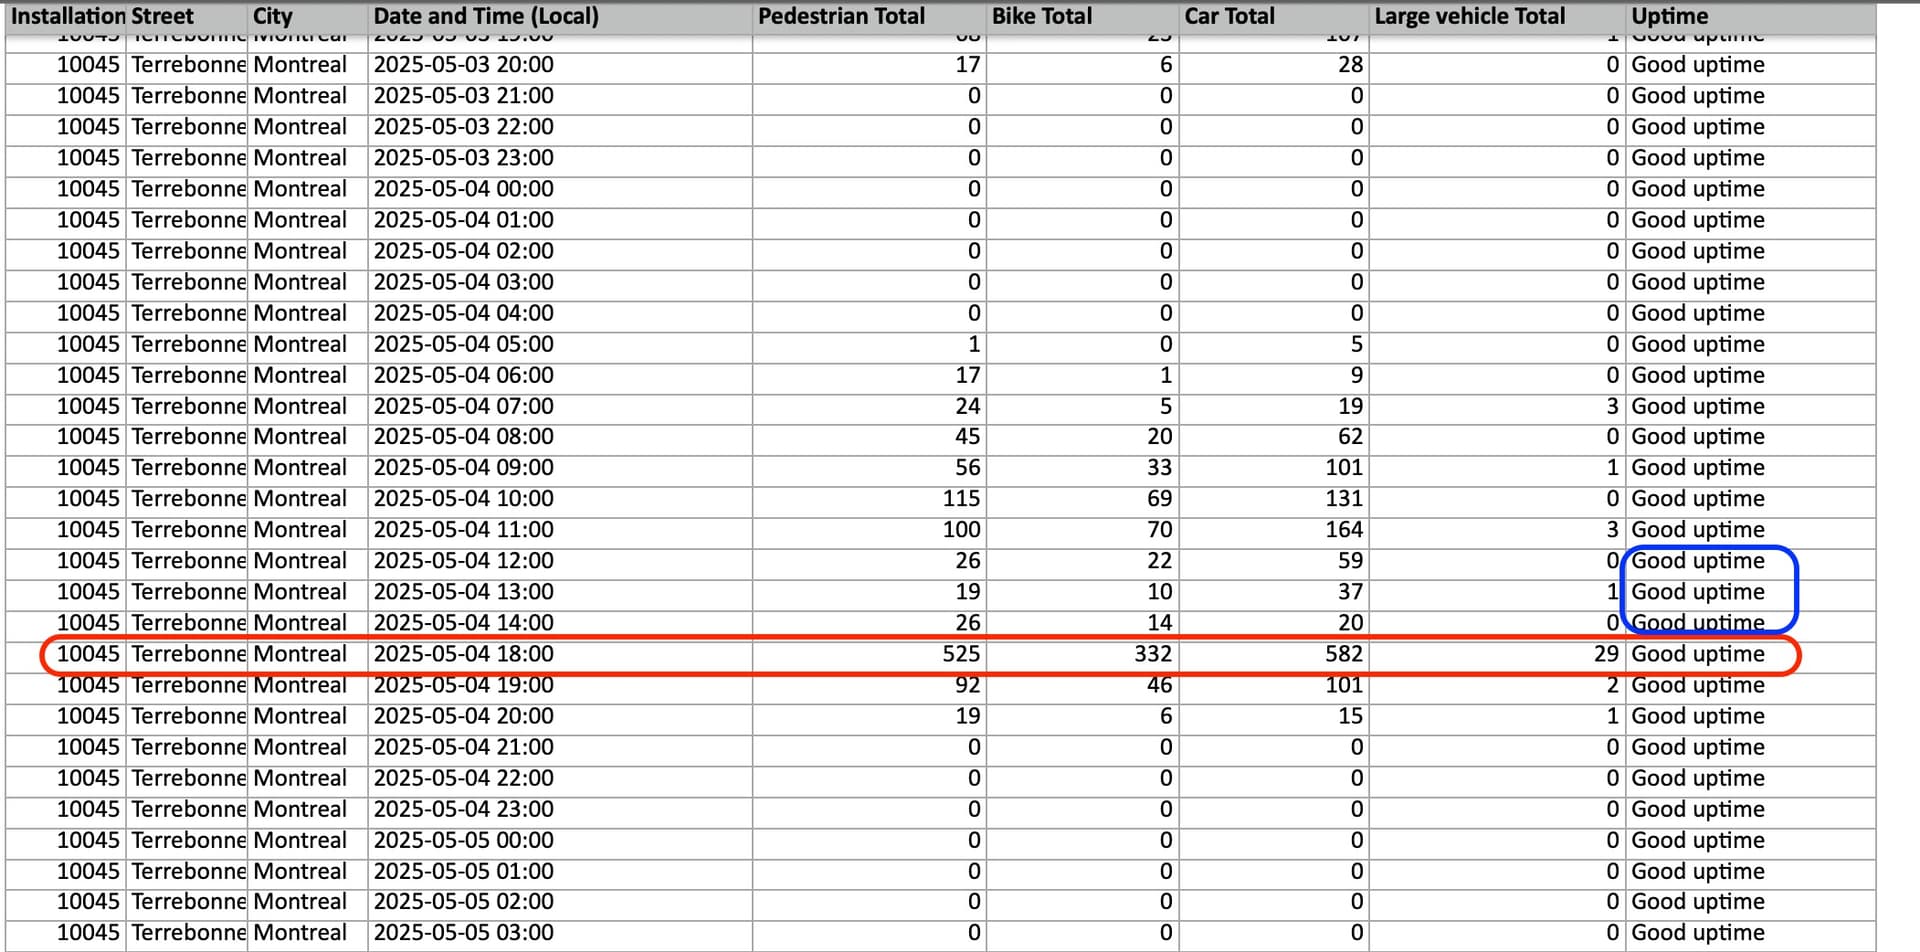
Here are several rows from a table of 2025 counts exported on June 1, covering hourly time bins for May 4, 2025 (some columns have been hidden for clarity):
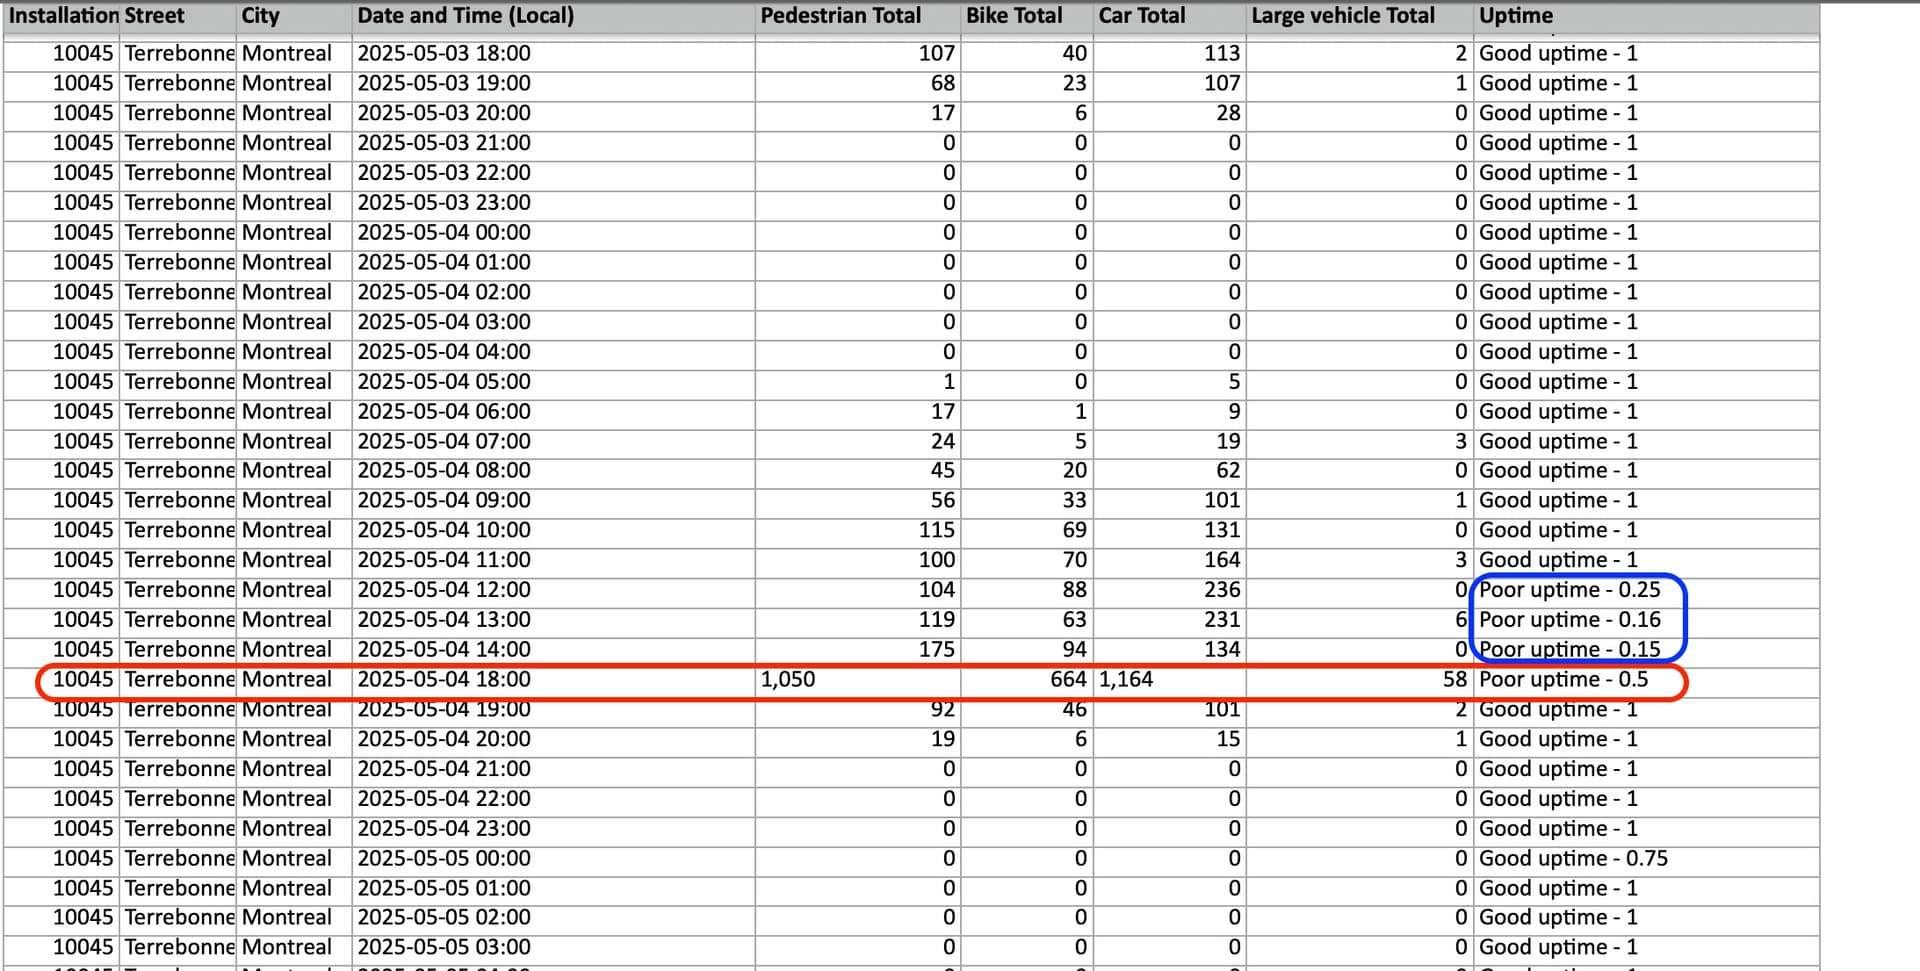
Today (June 7), I downloaded the current table for 2025 using the same settings. The corresponding rows give very different counts and “Uptime” indicators:
On closer inspection, even the earlier (June 1 download) bike/pedestrian counts for 18:00 on May 4 seem anomalous compared with adjacent time bins. The counts for the same 18:00 bin downloaded today are clearly off, giving over 1,000 counts respectively for both pedestrians and bikes. The format used in the Uptime column appears to have changed at some point between the June 1 and June 7 exports, so perhaps the discrepancy is related to other backend changes.
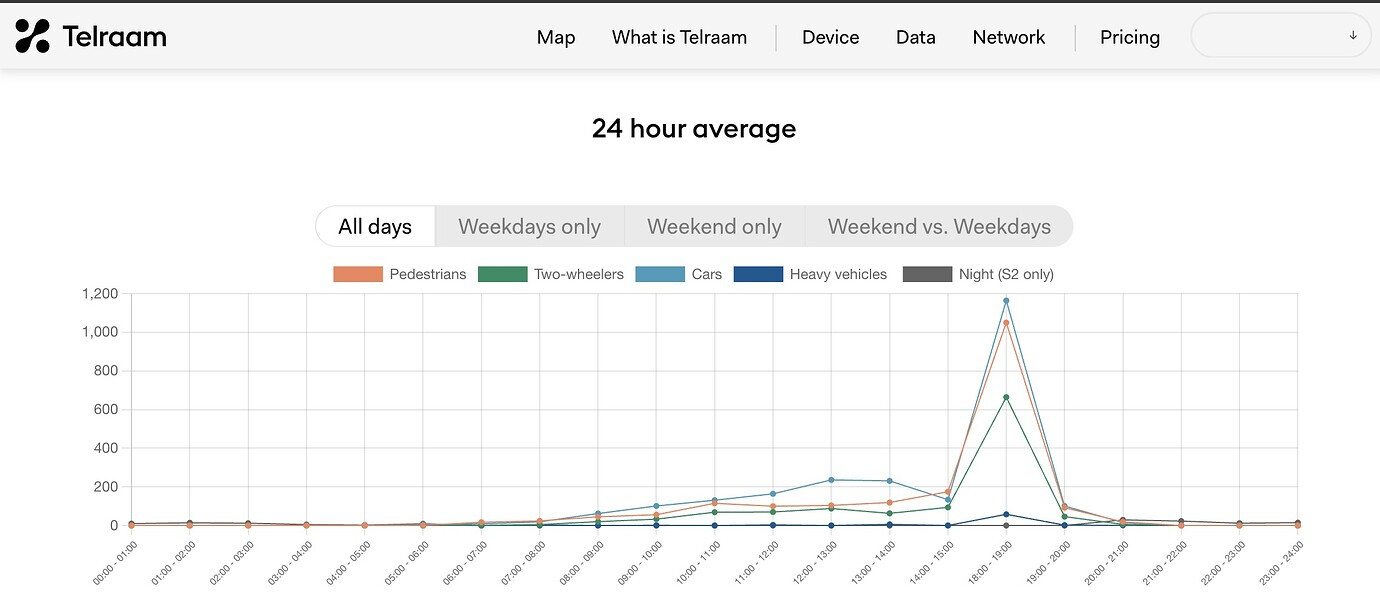
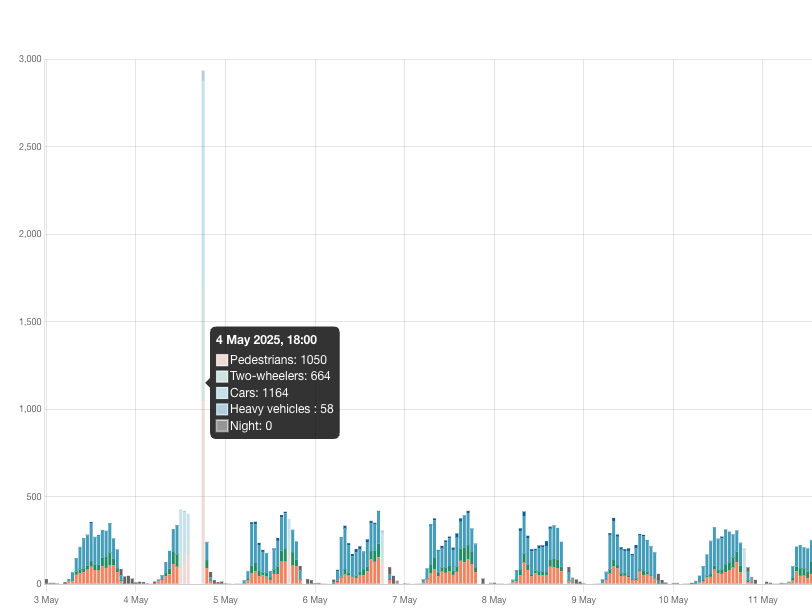
Currently (June 7), the web plots on the public Telraam portal correspond to the spuriously high counts downloaded today (note spike of over 1,000 at 18:00):
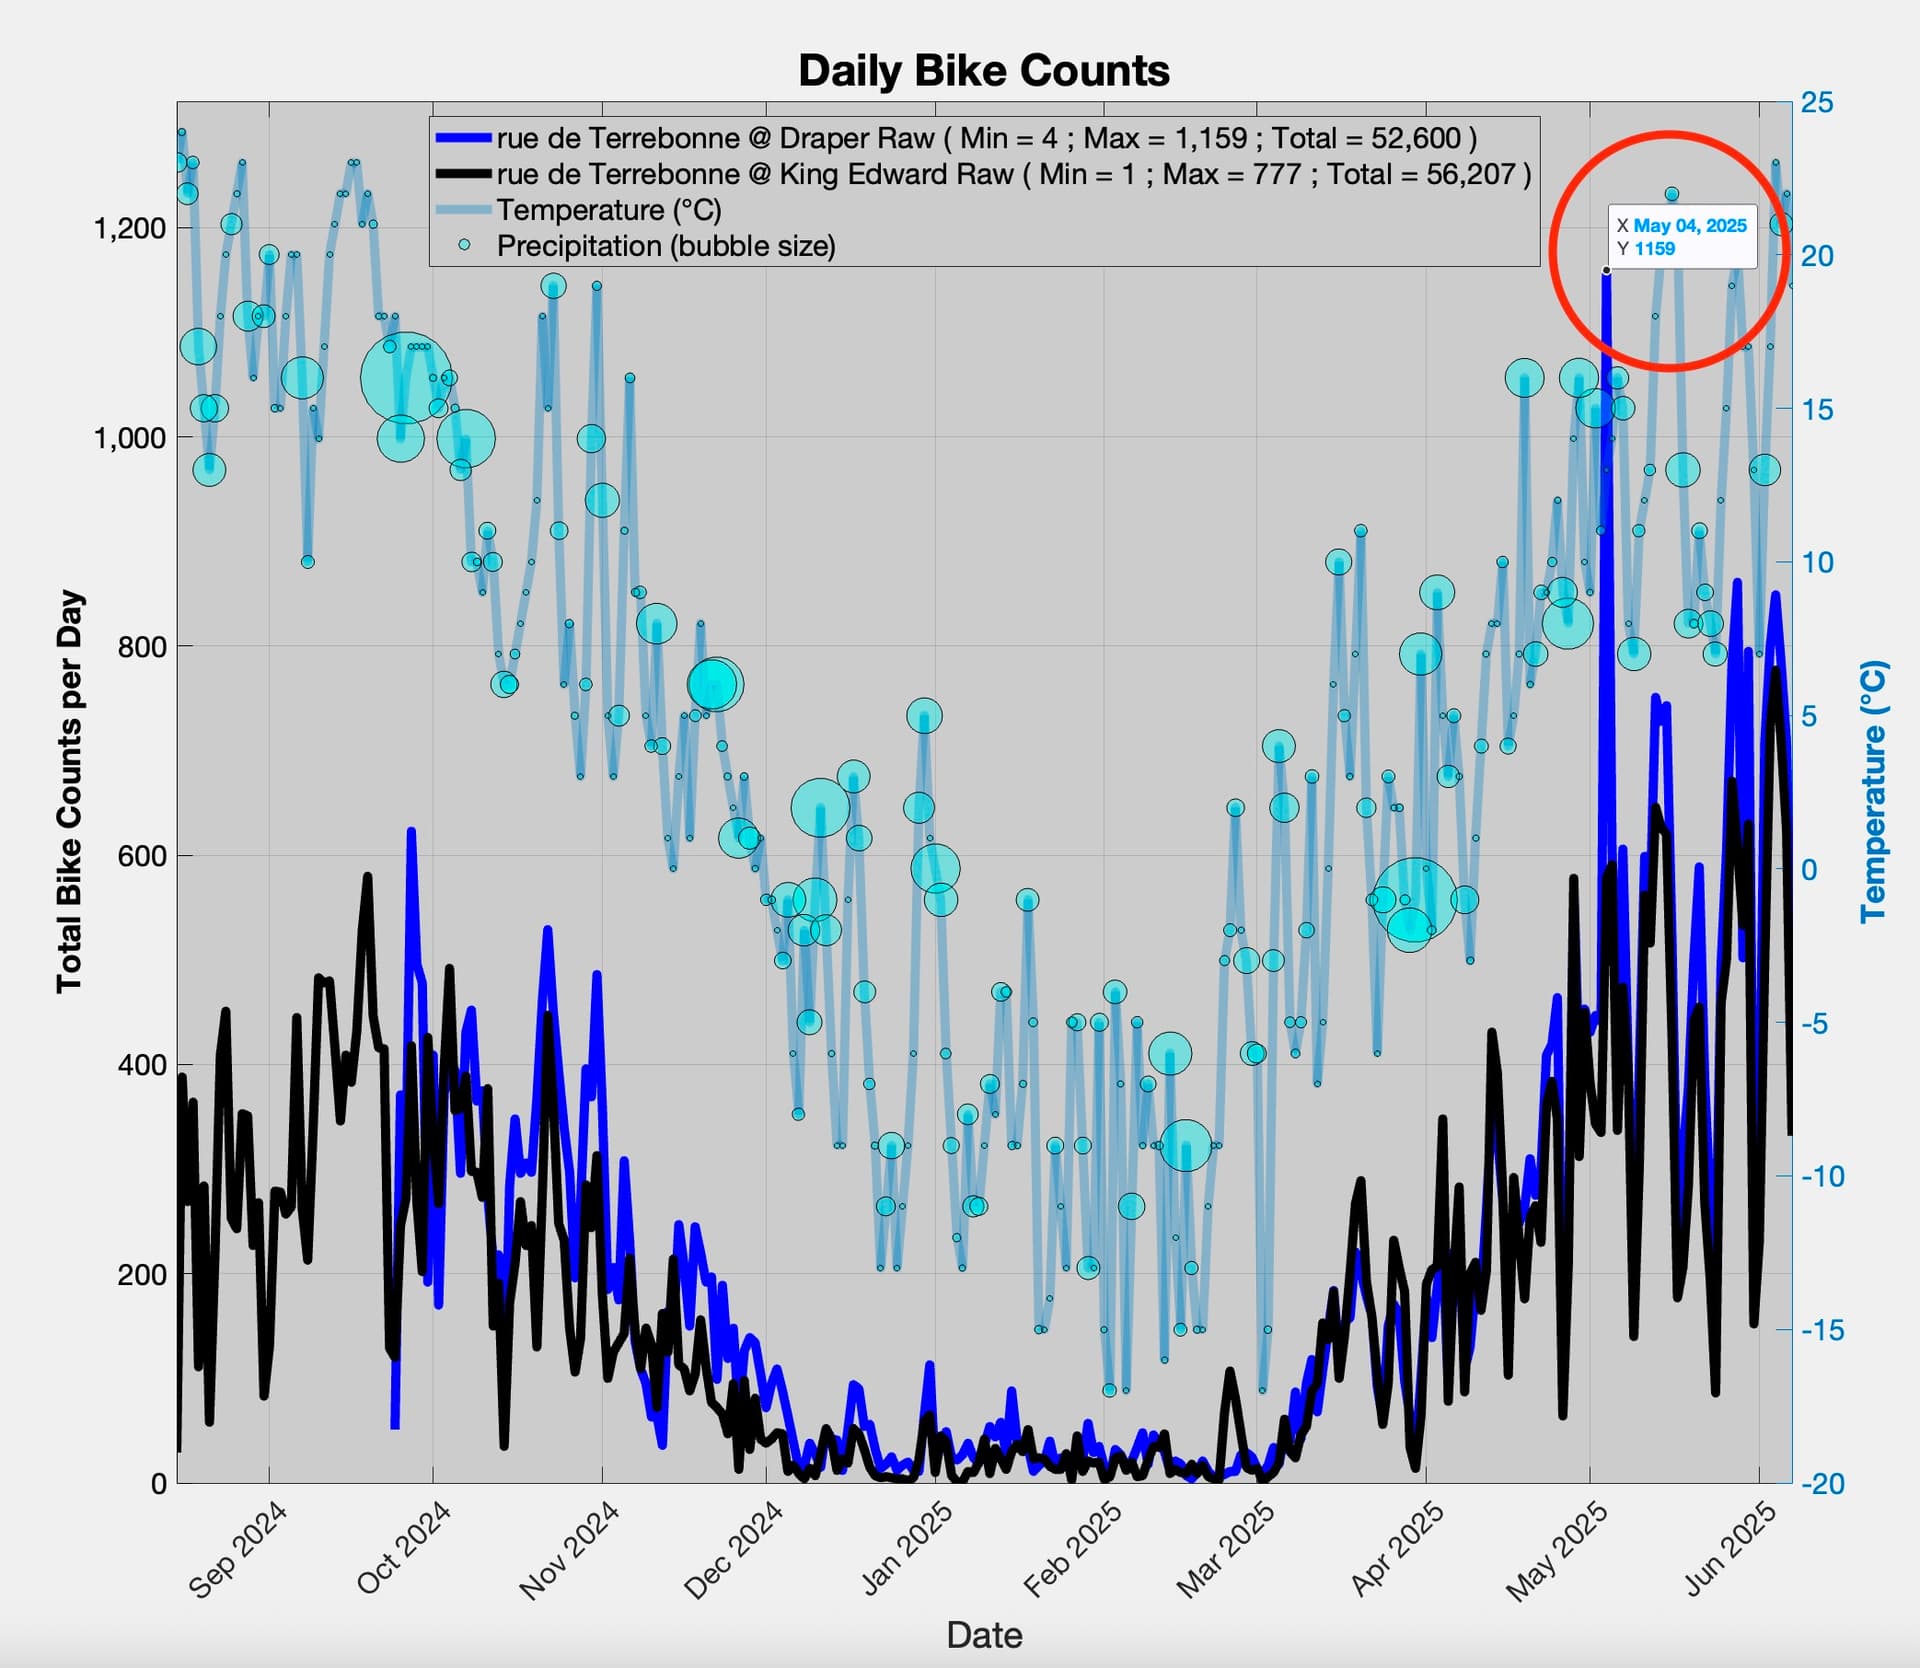
This glitch was easy to spot, as even a daily bike/pedestrian count of over 1,000 is a significant outlier on this segment (see plot below for two segments on the same street). It seems important to establish why row entries for a specific date/time might be changing in successive downloads, and result in such spuriously high counts.
Hi, there was a issue in the raw export which which was fixed last week. With poor uptime it showed (very) wrong results. However the “correct” one is indeed 1050 Pedestrians. I mean “correct” because it clearly it a to be neglected outlier as it has a poor data stamp.
I would like to add something with respect to the peak.
I believe this peak and 4h gap before is actually related to a bug in the FW that I discovered past month.
This is related to some operators sending time in UTC mode (2025-05-04T18:21:03+00:00) and others sending time in local time with Timezone (2025-05-04T18:30:00-04:00). In the code we were comparing the time not taking into account the different Timezone and this lead to a gap of 4h (= timezone) and the first data received being way too much (sum of 4h I believe).
Fortunately this issue does not happen that often and will be solved in a future 1.20 release.
Thanks for the followup - it makes sense as there was indeed a gap of four hours preceding the outlier data point.
I have always been including the Uptime flags, but was surprised to see that they had been changed from ‘Good’ to ‘Poor’ for the May 4 entries around 18:00.
I now run a basic outlier detection on the tables from our two counters, comparing each hourly count against the median of recent values for the same time and day of the week. In almost a year of operation, there seem to be only two outliers and they both correspond to a scenario like you describe.
The counter that has the two outliers tends to have lower uptime than the one with zero outliers, presumably due to a weaker wireless signal. Nevertheless the counts have seemed very reliable over almost a year of operation.