Your Telraam sensor has been installed and been counting for a full day? Then it’s time to have a look at the first data it collected.
Visit the map on the Telraam homepage . On this map, locate your counting point. If your sensor is counting, it will appear on the map as an active street portion, in green. Note that the exact location of your Telraam (e.g. house number) is not shown.
Click on your street segment to see the data recorded during the last hour. Want more data? Click on the “More data” button, at the bottom right of the screen, to gain access to a variety of statistics on traffic in your street.
Irregularities or inconsistencies? Give it some time!
If you have just installed your Telraam, it is important to know that the device will take some time to “calibrate”. Therefore, data collected in the first few days are merely approximate. Check the page on Telraam calibration for more info.
1. Statistics per time period
Here you can select a period of time using the menus above the statistics. The chart will show you the numbers recorded for each vehicle type (pedestrian, cyclist, car or large vehicle) during the requested period.
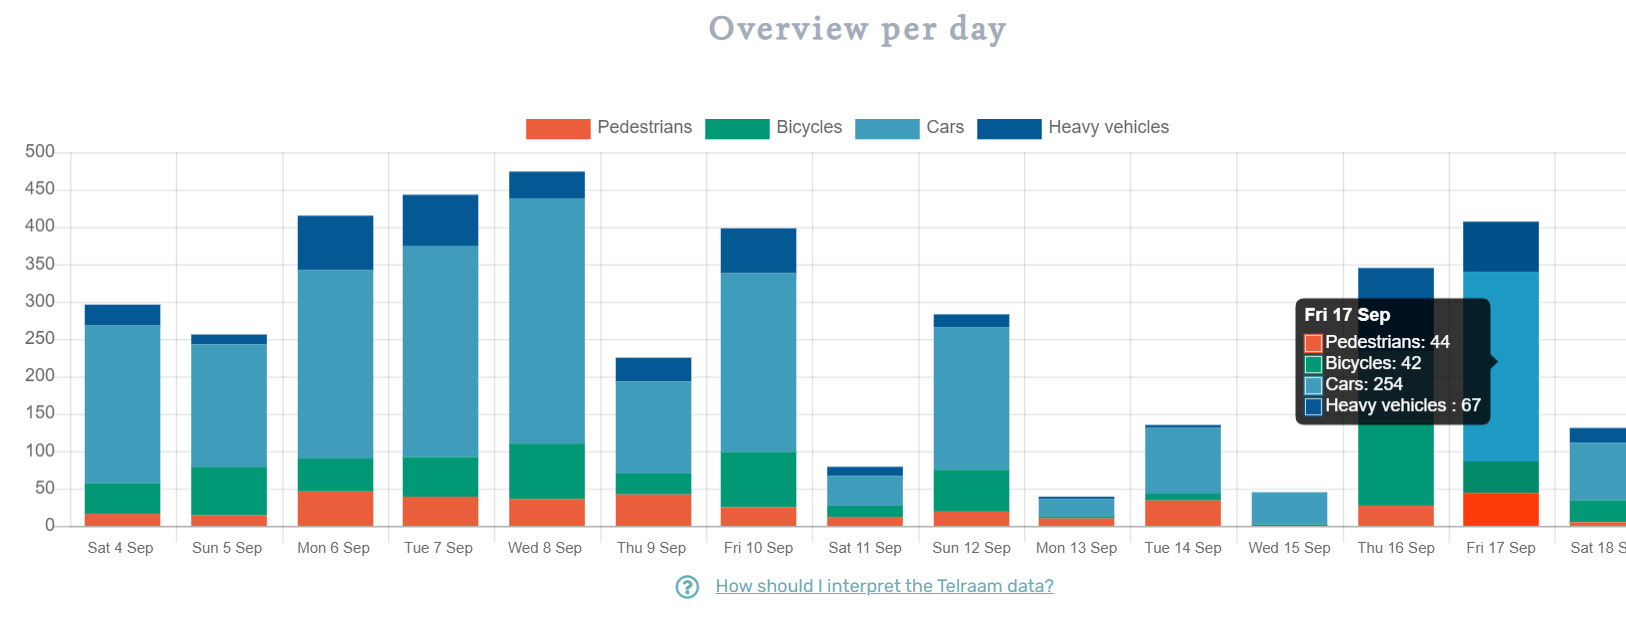
2. Overview per day
Here you will find the daily statistics of the last two weeks, again by vehicle type.
3. Overview in detail
Here, you will be able to visualize the statistics hour by hour. Just hover your cursor over the different segments.
As you go through the segments, you will notice that some time slots carry the label “Poor quality”. Click here for more information on how to interpret these specific data.
4. Average per 24 hours
The next graph shows a comparative average made by compiling the daily data of your Telraam, again hour by hour and per vehicle type. This graph allows you to see, on average, how many vehicles pass through your street segment at each moment of the day.
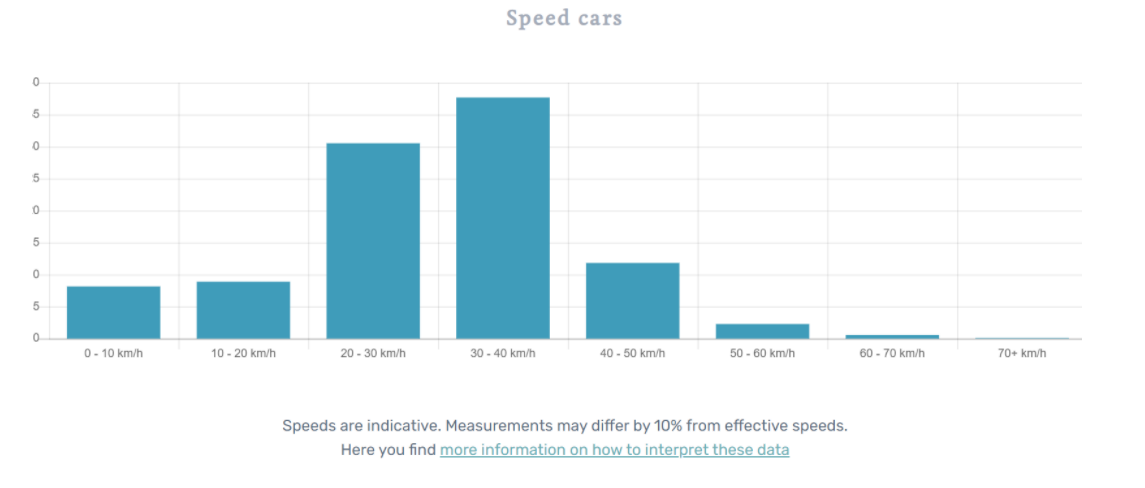
5. Car speed
This graph shows the speed of cars observed by your Telraam, in percentage and by speed range. The speeds are indicative. The measurements may differ from the actual speeds by up to 10%.
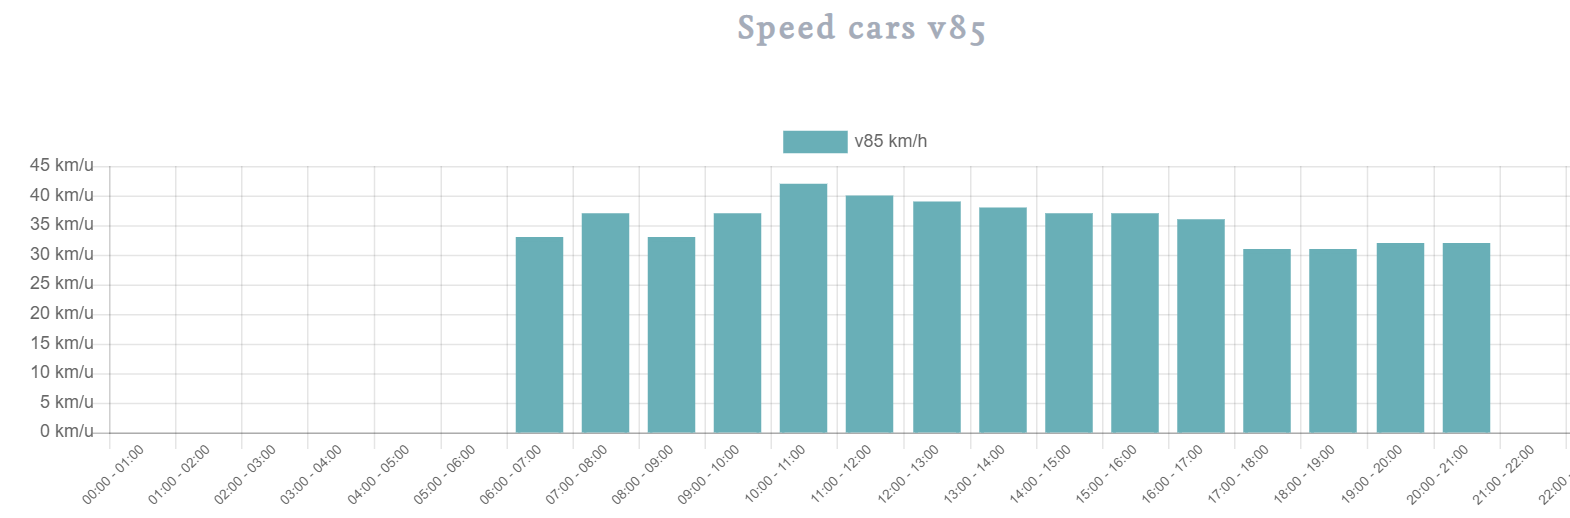
6. Car speed V85
The V85 is a widely used indicator in the world of mobility and road safety, as it is considered to be representative of the speed that can reasonably be maintained on a road. Click here to learn more about what V85 entails and why it is a useful indicator.
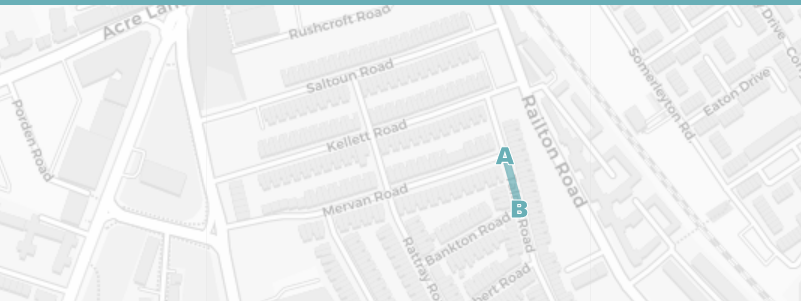
7. 24h average per direction
This graph shows the traffic statistics in your street segment by traffic direction. The statistics are divided into traffic “from A to B” and " from B to A".
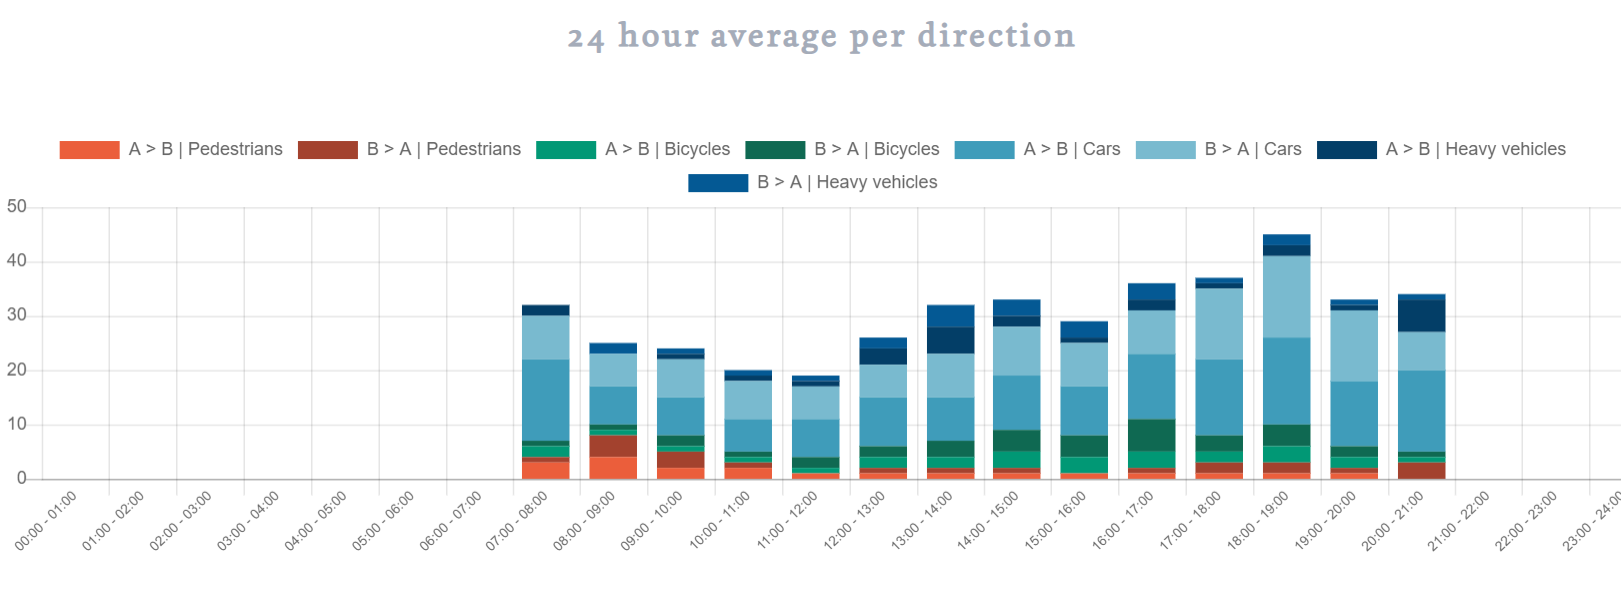
To identify which way is which, go to the top of the Dashboard web page. Here, your street segment is visible on a map. Points A and B are indicated.
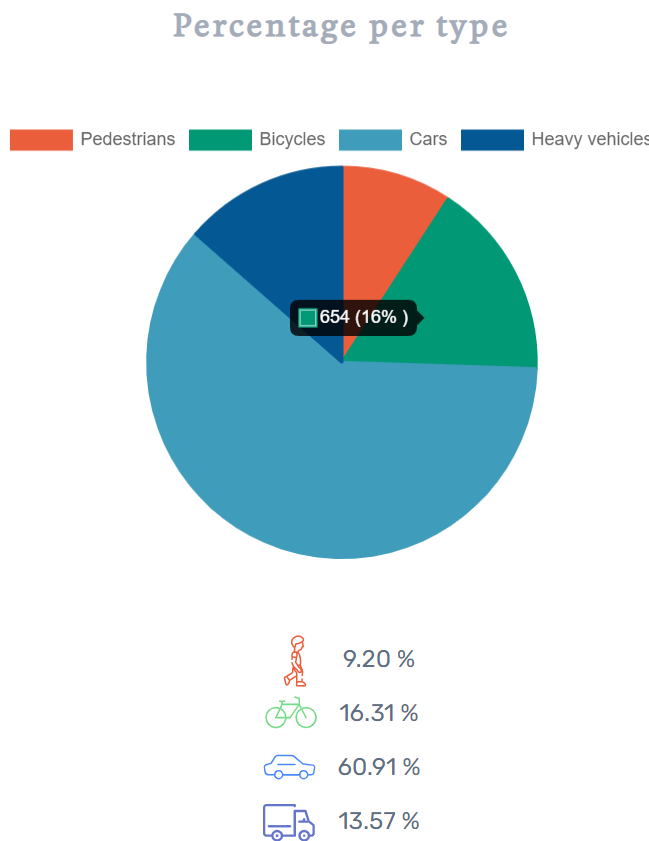
8. Percentage per type
This graph breaks down the collected data, for the time period you selected, into percentages for each vehicle type.
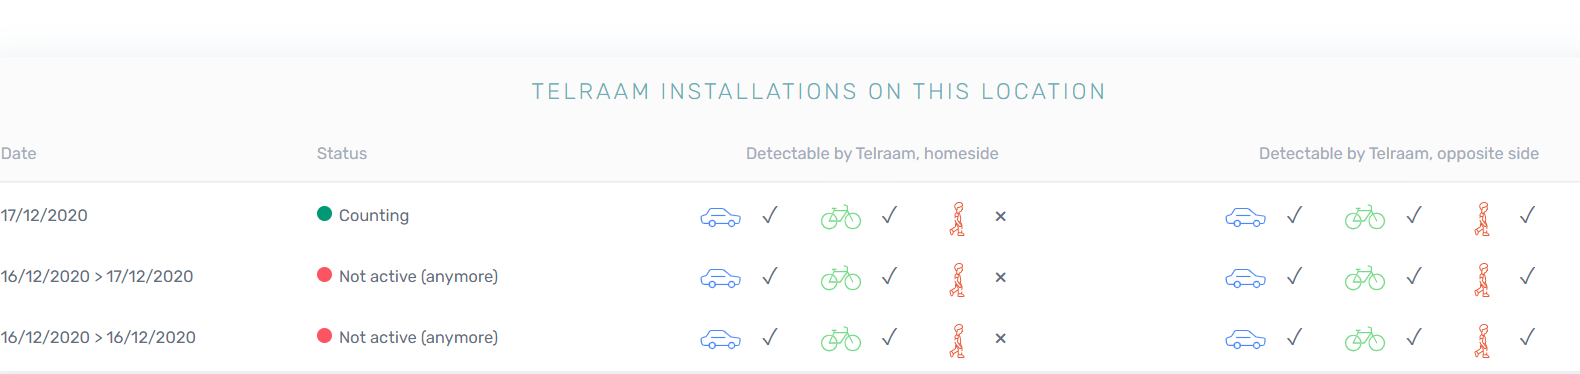
9. Telraam installations on this site
The final table on this Dashboard page summarizes your Telraam’s history: from the date of installation, over its current status, to the vehicle types it is able to register.
There you go: these were the basic Telraam data in a nutshell. Have fun consulting your Telraam data!