I was lucky to meet Rod King MBE, founder and Chair of the 20’s Plenty campaign in the UK, along with others leading this campaign, recently.
It was an interesting discussion about the goal of making 20 miles per hour (or 30 km per hour) the default limit in the UK for any roads where there is a mix of usage by cars and vulnerable users. This was just after an amazing workshop looking at the impact this change has had in Wales, and the reduction in injuries as a result.
One thing that came up which I thought I would share, is that I have a device on a major road in London that was switched from a 30mph limit to a 20mph limit in December 2023. No other speed interventions were put in place other than the signs, so … the question was, what effect did this have?
I had not researched it, so I couldn’t answer on the night, but I have had a look, and while I’m not a statistician, I can see a clear difference.
First check out the distribution of speeds for the two periods (Period 1 is May to July, 2023 and Period 2 is the same months in 2024)
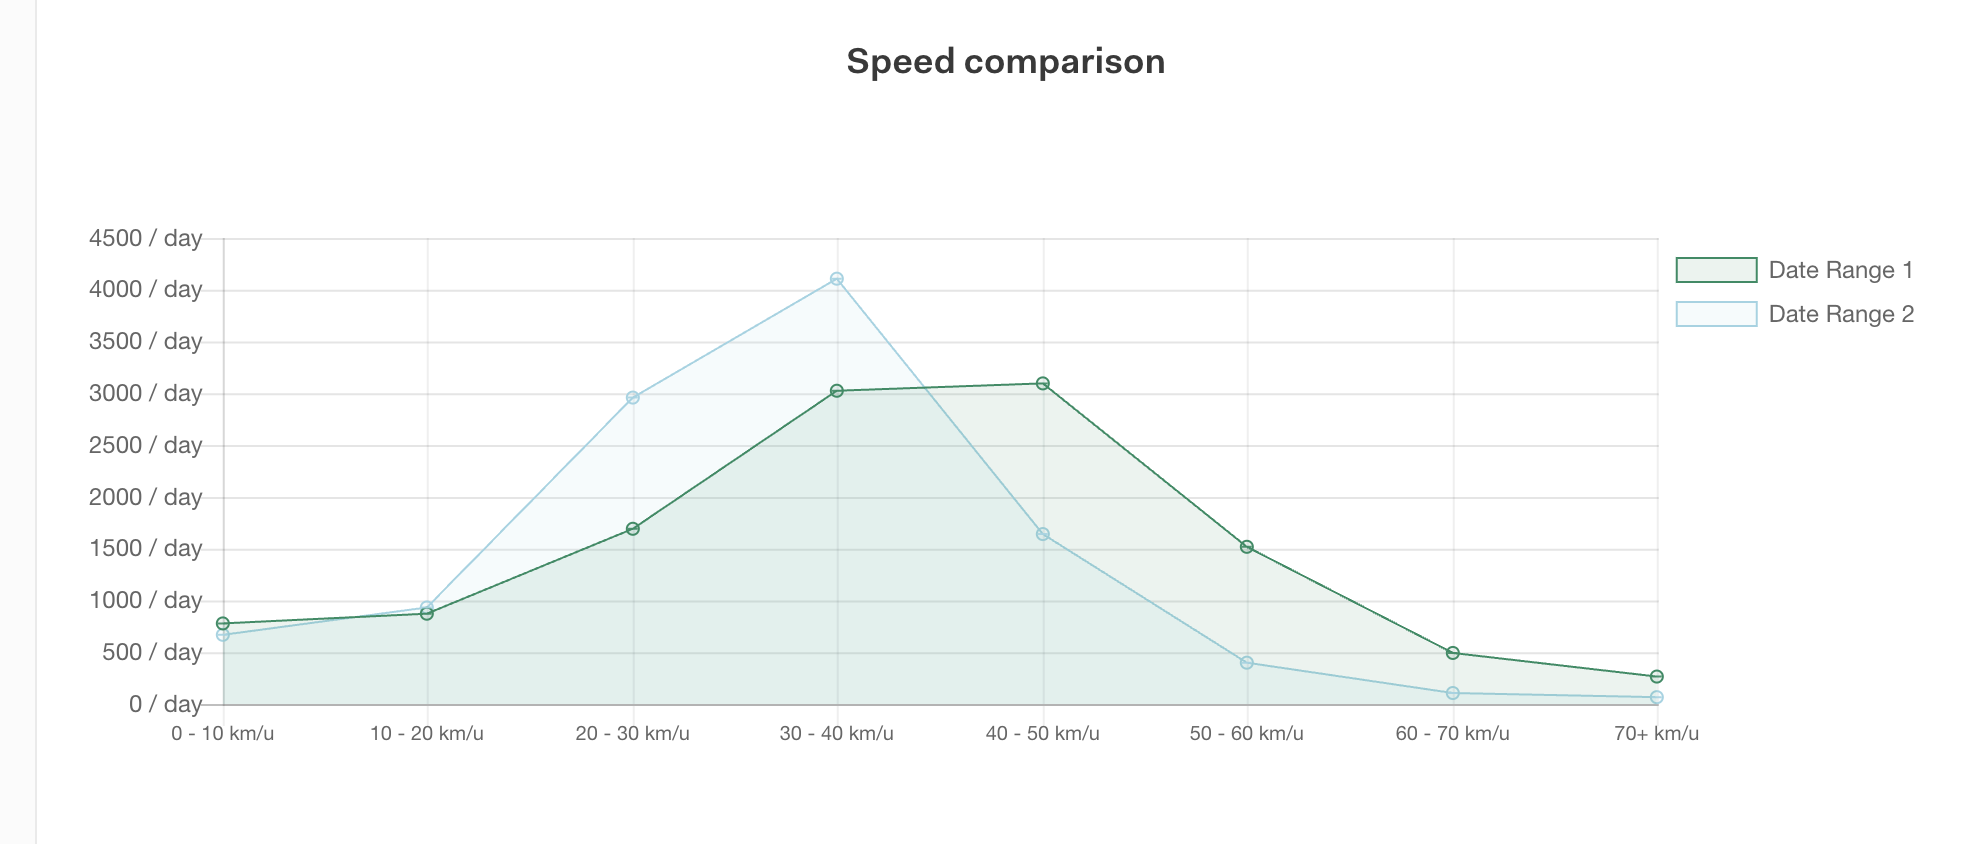
There is a clear difference in the number driving over 30kph (sorry about switching to kph here, but this report doesn’t convert to mph)
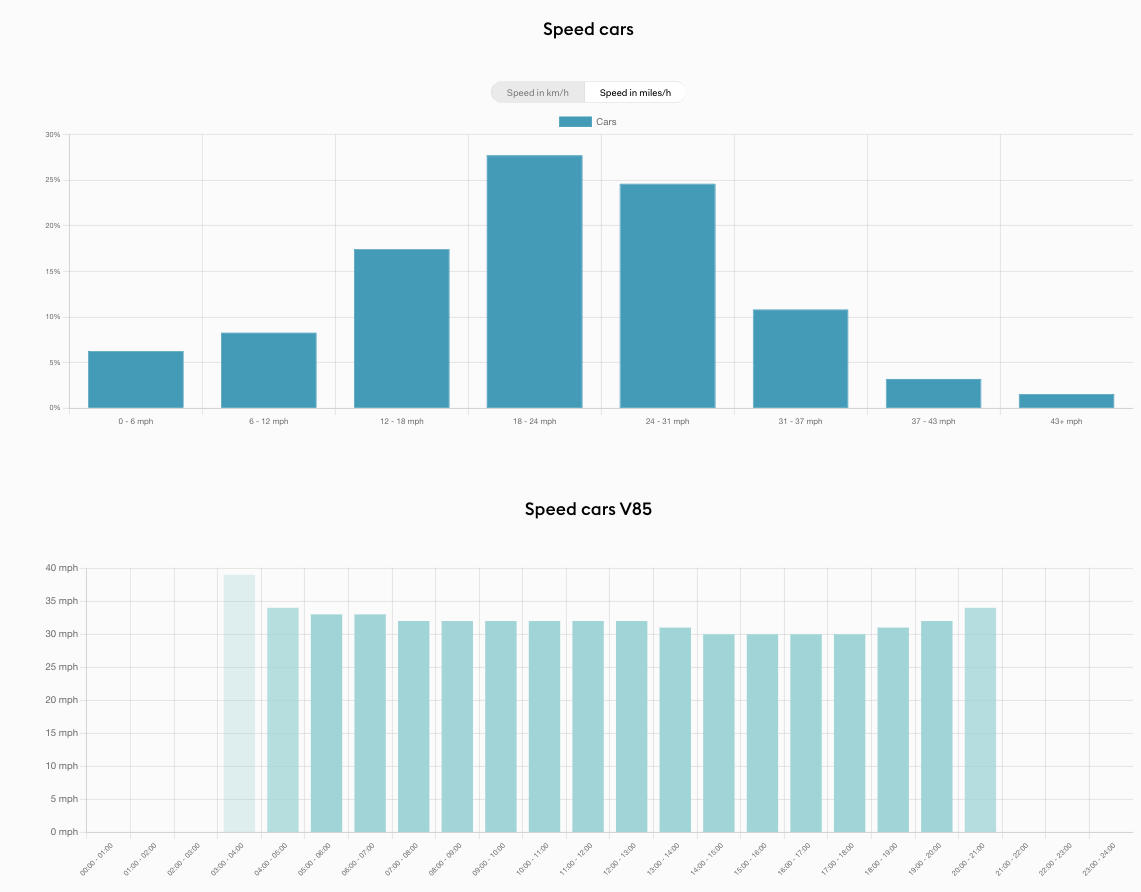
Here are the speed distributions and V85 for each period as well:
2023
and 2024
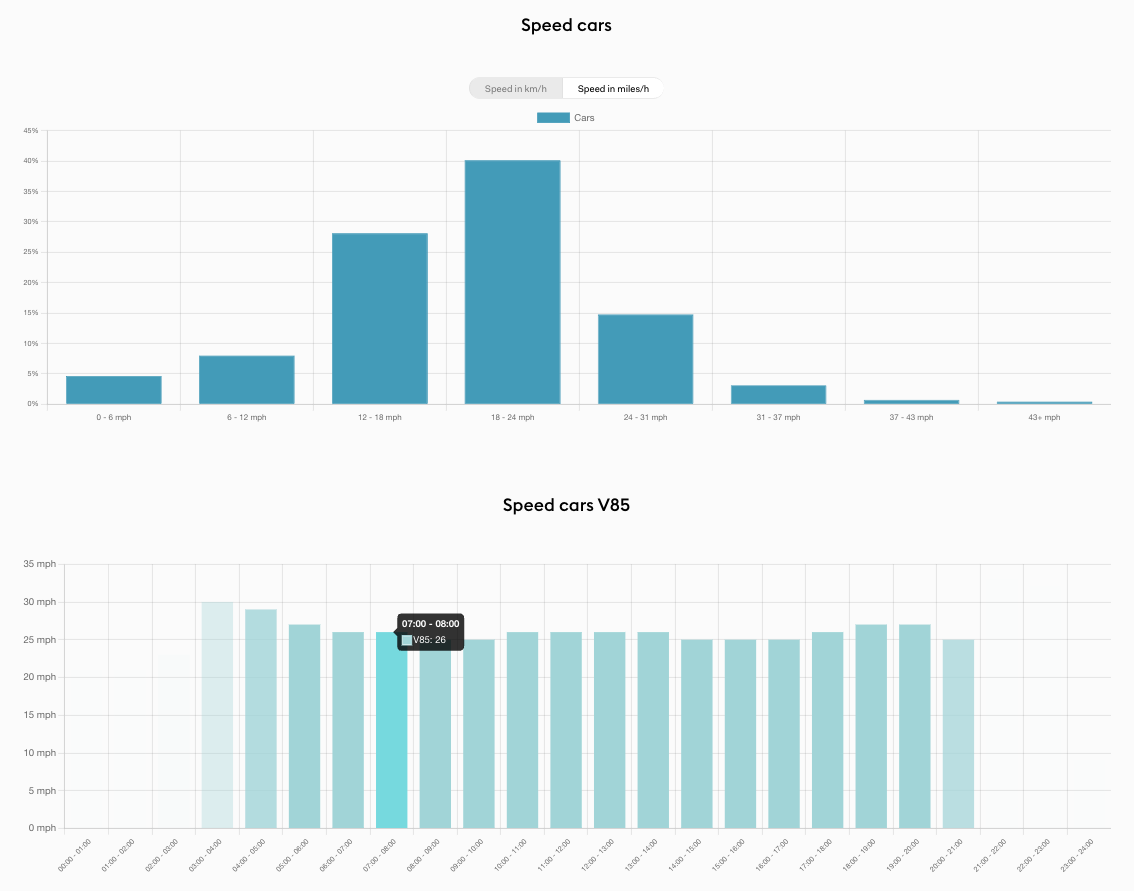
You will see that the V85 has reduced from 30mph to 25mph, which although not perfect, will make a substantial difference, I’m sure.
This is interesting for this particular campaign, but also highlights the benefits of long-term monitoring of the same segment as it makes future comparison and trend reports much easier to produce, whatever it is you are monitoring.