NOTE: This article refers to the classification method for the Telraam V1. For information on the S2, please visit: What is Telraam
One of the most frequently questioned values in Telraam data is the amount of objects that are currently labelled on the website as trucks. There are a few things that needs to be clarified in this topic to understand what exactly the displayed data is, how do we get the numbers, and what the possible inaccuracies are.
Classification
Without going into the full depths of how the classifier works, let us just note the most fundamental pillars of it. Classification is based on the average observed fullness and axis ratio of each observed object (that satisfies a set of criteria that helps filtering out any movement in the field of view that is likely not connected to road users). These two parameters are distance (between the camera and the object) and speed independent, meaning that a car 10 meters or 5 meters from the camera driving 10 or 80 km/h will still have the same axis ratio and fullness value.
To have a better grasp of what axis ratio and fullness is, take a look at the figures above. The black rectangular shape is the circumscribed rectangle, while the width and the height are represented by the arrows. The area of the car or cyclists is represented here by the red shaded area. Fullness means how well this red shaded area fills up the space inside the black rectangle. Axis ratio is the ratio of the two arrows. It is easy to see, that the fullness of the car is significantly larger than the fullness of the cyclist (and it becomes even more so when we are looking at the objects from the typical height of a Telraam camera), while the axis ratio of the cyclists (around 1, since width and height is more or less the same) is larger than the axisratio of the car (where width is twice the height, so axis ratio = width/height = 0.5).
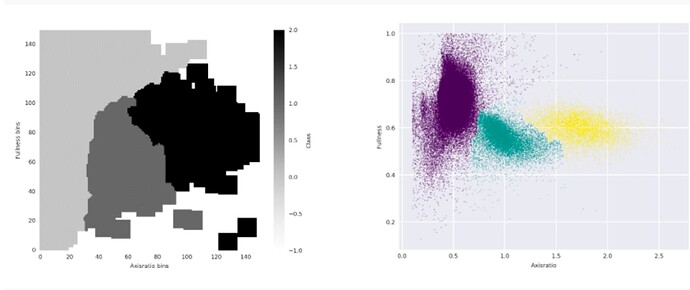
Classification is done using these parameters by a global classifier, which is basically a two dimensional lookup table where we have (using an automated method) defined areas (in the axis ratio fullness parameter space) where cars, cyclists, and pedestrians will typically fall. You can see such a lookup matrix below, along with a set of classified objects (that was actually the training set for the classifier). Using a global classifier means that right now we use the same classifier for each camera. (This is a valid approach since axis ratio and fullness are distance and speed independent, but there are possible uncertainties here which means that in the future we will move to camera specific classifiers.)
Left: The final lookup map – the classifier matrix – of the parameter space with class labels (-1 unlabelled empty space, 0-1-2 cars-bikes-pedestrians). Right: The individual objects coloured corresponding their object class.
So when a new object is transferred to the server, the server looks up the class corresponding to the object’s axis ratio and fullness value in the lookup table, and as such it is classified as a car, a cyclist, or a pedestrian. The story ends here for cyclists and pedestrians, but cars at this stage still contain both passenger cars and larger motorized vehicles such as vans, trucks, and buses.
Separating Cars from Vans, Trucks, and Buses
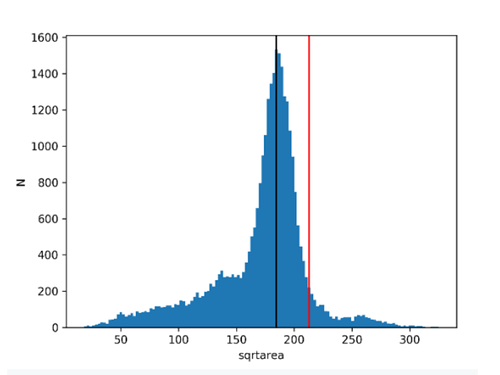
We separate cars from larger motorized vehicles based on size. We do not know absolute sizes (since we do not know the exact distance between the camera and each observed object), but we can assume that most cars passing in front of the camera are near the typical size of a passenger car (which is around 4.1 meters in length in Belgium), meaning that in the size distribution (histogram) we expect to see a well defined peak that corresponds to this physical size. Knowing the typical size of a car, and a van from statistics, we can set a limit in size that separates cars from vans. From manufacturer data we have derived that if the typical size (which in this case is the visible projected surface area from the camera’s point of view) for a passenger car is 1 unit (e.g., VW Golf, Renault Clio, Opel Corsa), then the typical size of a van is 1.4-1.6 units (e.g., VW Transporter, Ford Transit), while for SUVs this is 1.15-1.2 units (e.g., BMW X1). We want to put the cutoff between SUVs and vans, so we have set it at 1.33 units. Therefore in the histogram when an object’s size is below 1.33 times the peak in the histogram (which is assumed to correspond to the typical car size) then it is a passenger car, when it is above 1.33 then it is either a van or a truck. This calculation is done on a camera-by-camera basis, and for each camera it is done for the two direction separately (to try to fix the distance between moving objects and the camera).
Example of the typical size (black vertical line), and the cutoff limit (red vertical line) derived from the histogram of objects identified as cars using the process described above for a randomly selected camera and direction. The tail of the distribution to the right of the cutoff is made up of vans, while even further to larger sizes a small peak and the distribution around contains trucks and buses. It is clear that there is a continuous transition between cars and vans, while in optimal cases a more clear separation between vans and trucks/buses.
After a few months of operation, we have seen that while this system works reasonably well in average situations, but there are specific cases where it gets compromised. Without going into detail, these cases are the following:
Streets that are one way for cars (or that are car free) can still produce (a significant amount of) cars and trucks in our measurements.
Why is this? It is not because so many people ignore traffic signs, but rather unluckily an artefact of a limitation on our side. First of all, during classification, our system – at this point – is not aware that it should not classify an object as car if its properties (axis ratio and fullness) place it in the zone of the global classifier matrix where cars are. This means that even when there are no cars passing by, bikers, or a close group of two or more bikers can be classified as cars. Even two cyclists close to each other (overlapping from the camera’s point of view), can result in a single object that is larger than a typical cyclist should be. This will result in the combined shape of the two cyclists being classified as a car. Now given a one way street or a street that is not allowed for cars, the automatic cutoff calculation for cars/trucks will take all these misclassified cyclists, and apply the algorithm that we have discussed above. But in this case, there are no cars in the distribution, therefore the histogram will be dominated by pseudo objects with a much smaller size than actual cars would have. Both the typical size and cutoff will be calculated from these spurious values, resulting in a cutoff value that will sit somewhere in the observed distribution. But since the observed distribution comes from misclassified bikes, the ones above the cutoff will get classified as trucks, even though their absolute size might be much smaller than one would expect. There are a few possible workarounds, but we have not yet found the best solution yet.
It also happens that at certain hours of the day, there is a significantly larger percentage of trucks observed than at other times during the day.
In normal cases a single car can turn into a truck if the light conditions are right. While the previously discussed issue arises on streets that are not permitted (in at least one direction) for cars, this can happen anywhere. What actually happens is that when the sun is low and shines along a given street, long shadows are cast by moving objects. (When the sun is high, shadows are small and do not reach far from the casting objects, and when the sun is low but it does not shine along the street axis then the road surface is usually not in the sunshine therefore objects do not get an extra shadow.) Our image detection algorithm can not differentiate between shadows and casting objects, therefore the shadows are observed as part of an object. In most cases this is not an issue, because the shadow will not change the important parameters of the object so much that it would lead to misclassification, but in extreme cases it can be an issue for two reasons:
- The case of cars with long shadows parallel to the street: This will significantly elongate the observed shape of cars, and raise the observed sizes, therefore likely to cause a misclassification of these cars as trucks It depends on the time of the year and time of the day, but the take away message is that if there is at one point during the day low sun shining parallel to the street surface, this anomaly is expected to be seen, and will cause a temporary boost in the percentage of vans/trucks/buses in the motorized vehicle group (meaning also a temporary drop in car percentage).
- The case of one or a few cyclists riding together: cyclists even when they do not overlap from the camera’s point of view, can be merged by a shadow that is cast by one (or more) of them. This artificially enhances the size (and the axis ratio and the fullness) of the observed merged


