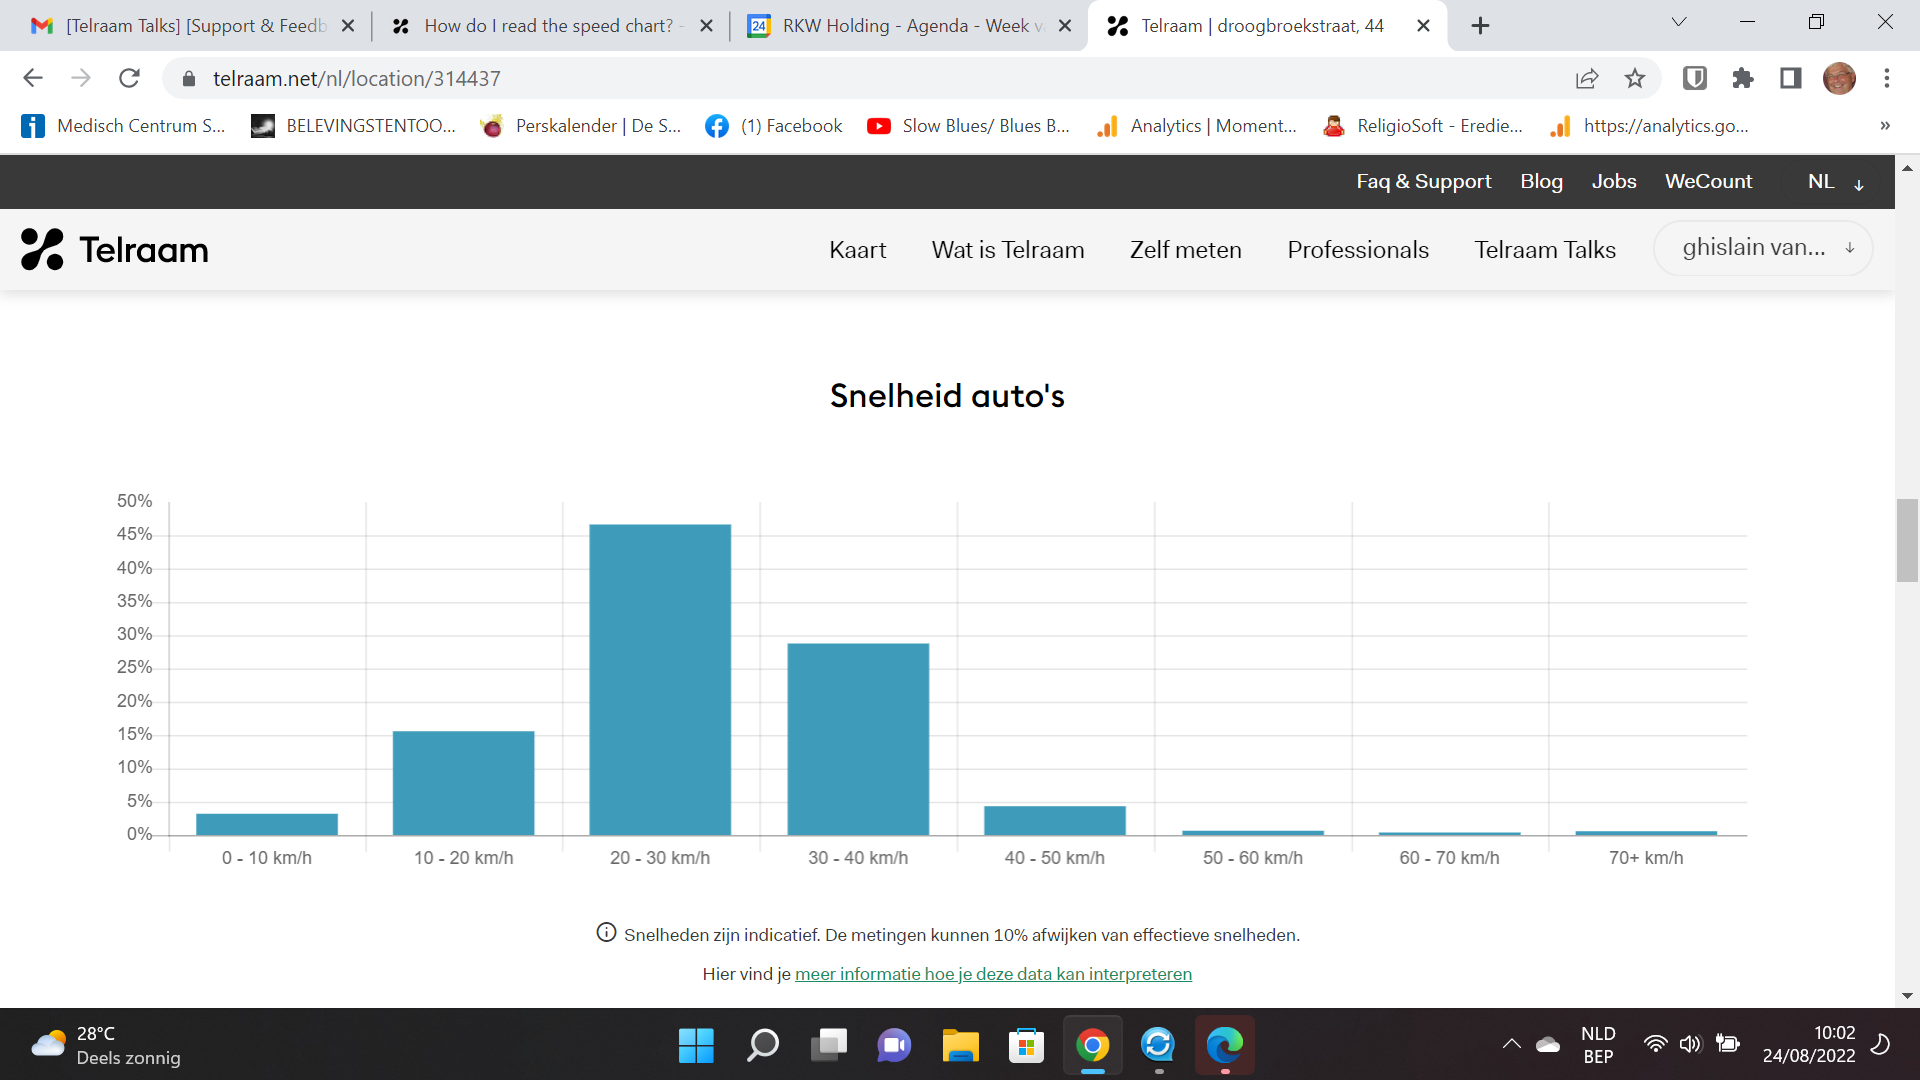
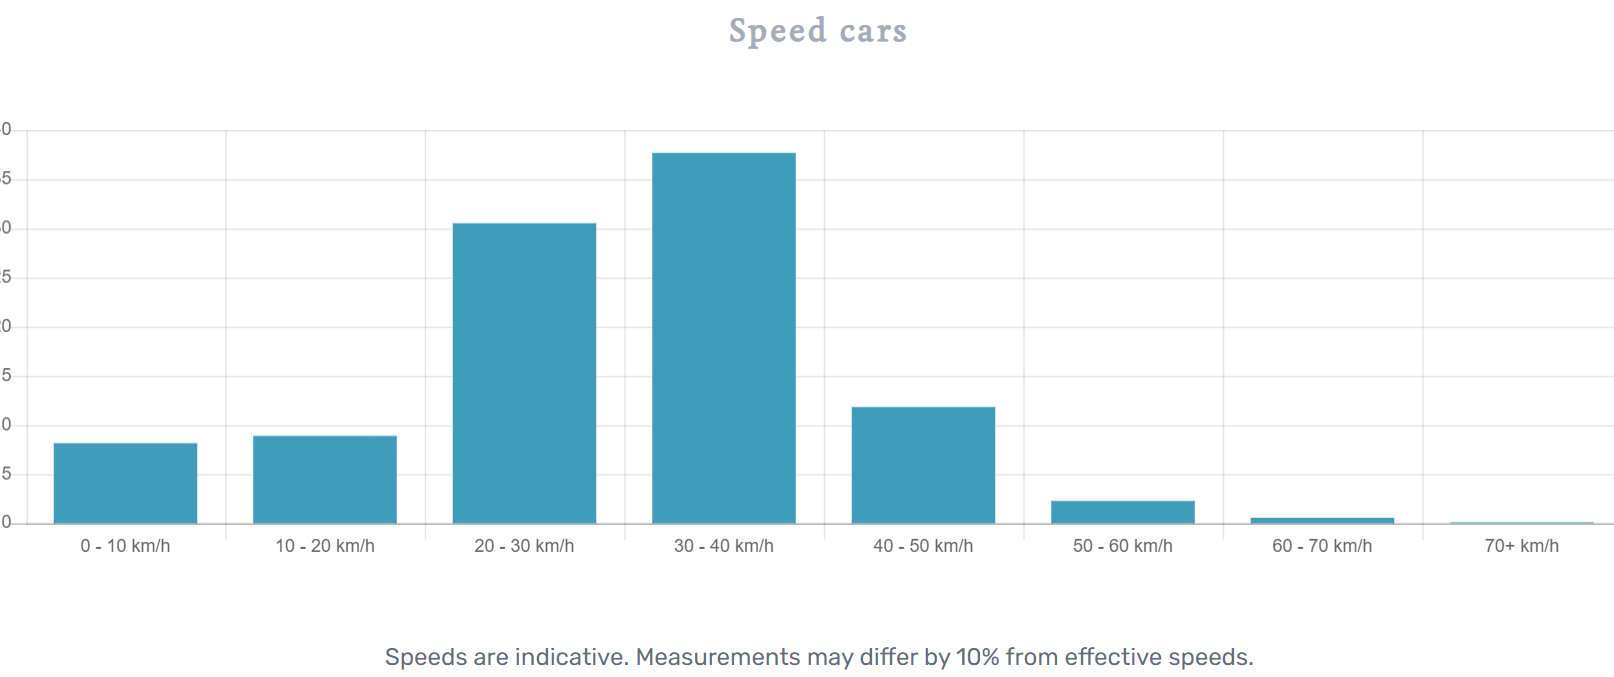
The speed chart is a bar chart showing the percentage of cars per speed level, for the period you selected at the top of the page.
How accurate is the chart?
Speed statistics are indicative. Measurements may differ by 10% from effective speeds, yet provide a good basis for comparison with other streets.
Outliers
Sometimes, the speed chart shows outliers. These are measurements in which something went wrong. Telraam does not filter for such errors.
Example 1: Your Telraam might indicate that a car drove faster than 70km/h through your bendy street, even though that seems physically impossible.
Example 2: Your Telraam might indicate that a car drove less than 10 km/h. Here, the explanation is probably a misclassification. A group of cyclists might have been classified as a car. Click here to learn more about how Telraam’s classification works.
If you suspect a problem with the speed measurements, please report it to the Telraam team by sending us a mail at support@telraam.net.
Is Telraam a speed camera?
No, certainly not. Telraam cannot make a statement about the speed of individual cars. At the level of individual vehicles, measurement errors can be significant in both directions (faster or slower than in reality). This error corrects itself at the level of a group of cars, as there are more measurements.
What about large vehicle speeds?
Telraam cannot measure the speed for large vehicles because its measurements assume that objects within one group have the same typical length. For cars, the length of any given car will always be very close to the “typical car length”. It’s a relatively homogenous group. Large vehicles, however, are more heterogeneous in terms of length as they range from SUVs to long trucks and buses.