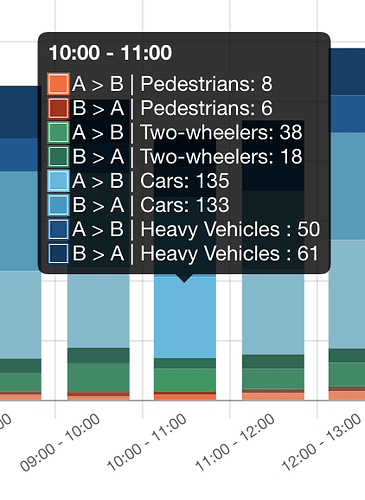
Deze grafiek is me niet heel duidelijk…
waar is A ? (boven of onderaan de straat - idem voor B…
er is weinig kleurenverschil tussen de respectievelijke kleuren oranje/bruin - lichtblauw en lichterblauw - donker en donkerderblauw.
Is dus moeilijk leesbaar, wat maakt dat je ook moeilijk een analyse kan maken.
You have a good point here. Maybe there ought to be higher contrast colour differences between the modalities and directions in order to make the graph easier to read.
However, if you move your mouse over the graph (on the live page), you will see a breakdown of each colour with more information. Maybe this can help your analysis in the short term?

